

Gridlock
Why are there 8,100 renewable energy projects waiting for permission to join the U.S. grid?


A complex, inconsistent, and inflexible system for delivering electricity to homes and businesses across the U.S. is apparently the limiting factor in the nations push to increase energy capture from low-carbon sources.

Good News and Bad News for Low-Carbon Electricity in the U.S.
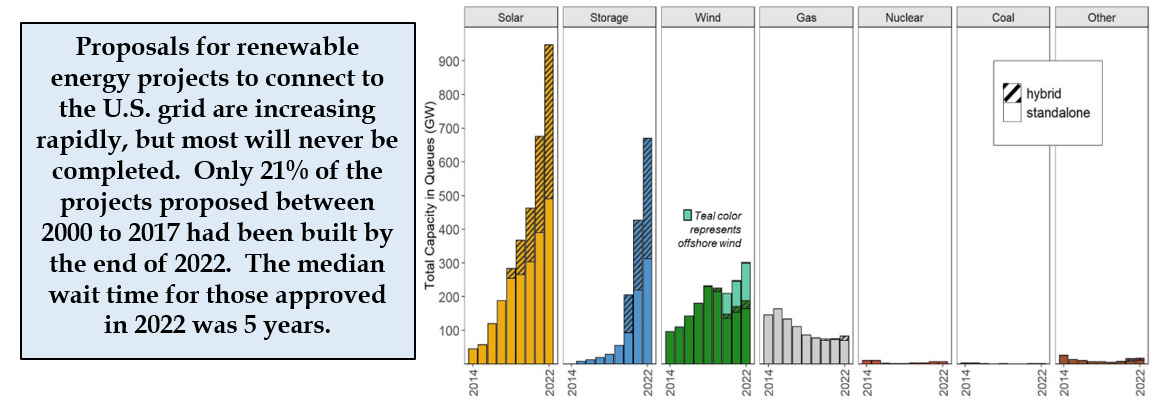
The good news is that there are 8,100+ proposed low-carbon electricity generation projects requesting connections to the U.S. national electrical grid system. And that number is increasing rapidly.
Combined, these proposed projects represent more than 1,250 GW (Gigawatts or 1 billion Watts) of capacity, or almost as much as the total installed capacity of all existing power plants in the country. So it seems there are enough renewable energy projects out there to meet all U.S. electrical demand, and the 680 GW of additional electrical storage projects proposed would seem to be enough to overcome the problem of inconsistent production from wind and solar sources.
The bad news is that very few of these projects will ever actually happen.
While renewable energy sources are gaining ground as a fraction of total electricity production in the U.S. and have outpaced natural gas in terms of the addition of new capacity over the last decade, their total contribution (wind, solar and hydro) remains small. Battery storage capacity is now included in these statistics, given the importance of storing wind and solar energy during calm and dark periods.
Realized capacity increases are on the order of 30 GW per year, or less than 2.5% of the 1,250 GWs either in the backlog or currently in operation.

In How to Avoid a Climate Disaster, Bill Gates proposes a transition to an all-electric economy paired with zero-carbon sources of electricity as a viable pathway for climate disaster avoidance. Global momentum towards all-electric automobile and truck fleets appears to be the first wave in that transition.
An earlier essay here compared Gates' generally upbeat perspective with that of Vaclav Smil, one of our most prolific and quantitative energy writers. In How the World Really Works, Smil cites the inherent inertia in the global energy system and stresses that change will be slow, very slow.
Given the rate at which new sources are being attached to the grid as a fraction of proposals or existing capacity (<2.5%), Smil seems to be winning the argument, at least in terms of large scale, centralized, grid-based systems in the U.S. (we'll talk about decentralized, "Behind the Meter" additions in the next essay two weeks from now).
What is Causing this Huge Backlog?
A recent article describes in detail the process for proposing to connect new electrical generation plants to the grid. The rate limiting step here is the approval of the operators of the local-to-regional grids (also called "Balancing Authorities") that is required to allow these new projects to connect. That approval process determines whether the proposed project can be added to the grid without overwhelming or disrupting the smooth delivery of energy.
That apparently logical process has come up against two roadblocks.
One is the very rapid increase in the number of submitted proposals that has overwhelmed staff at those local-to-regional grid operators, so that review times have increased to more than 5 years. In a Catch-22 moment, long delays have caused firms ready to build projects to submit proposals for more than one project to more than one grid company, further clogging the system. In response to the backlog, some grid operators have stopped accepting proposals.
The second issue limiting new connections to the grid is cost. If new power-generation projects will cause overload to the local grid system, the proposer is often required to fund upgrades to that system to accommodate the growth. One interviewee in the article likens this to saying that if the last car entering a road overloads the road, the driver of that car should have to upgrade the entire highway. Another says that engineering the upgrade is not the limiting factor, but rather deciding who will pay for it.
So in other words, this is not a technical problem but a political and economic one, and as this Substack site does not delve into politics, we won't go deeper into that issue. Still, it might be interesting to just describe the current production and distribution system providing electricity across the U.S. and compare that with other developed countries.
Electricity Distribution in the U.S.
Web-based sources reveal a bewildering array of organizations involved in the distribution of electricity in the U.S. with apparently overlapping areas of responsibility. At the lowest level, a total of 66 "Balancing Authorities" are tasked with maintaining the continuous flow of energy within and between their respective areas. These are private companies and confederations of companies, and are the ones that need to approve new connections.
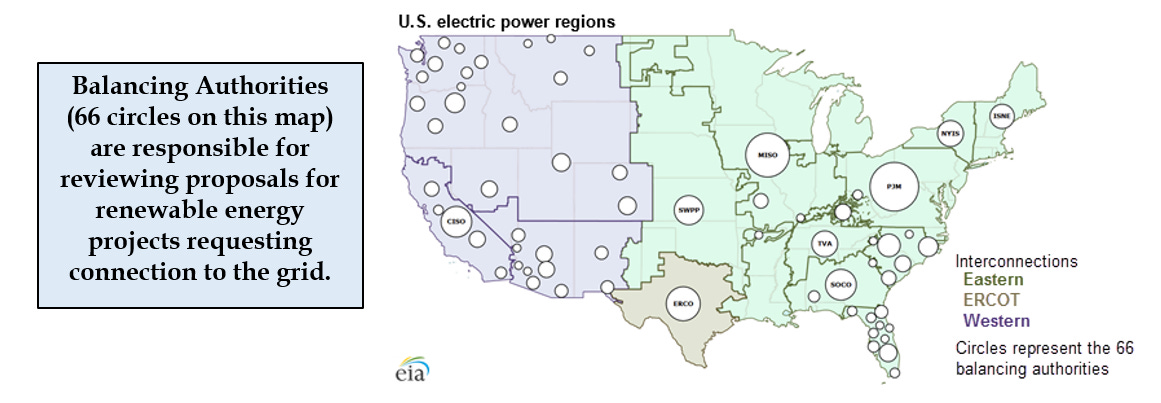
So there are lots of places to submit proposals, and they are wildly variable in size. Some cover several states while there are 10 just in Florida alone. In this figure from the U. S. Energy Information Administration, the Balancing Authorities are grouped into three large interconnection regions
However, there are a number of different maps describing the organization of the grid across the U.S. (and sometimes Canada as well). Included in this array of maps and organizations are ISOs (Independent System Operators) and RTOs (Regional Transmission Organizations) which appear to have nearly identical definitions, were both established by the Federal Energy Regulatory Commission (FERC) and are both responsible for maintaining continuous, quality service within their regions. Either of these can also be Balancing Authorities (or not).

And then there are also economic or marketing units within the system.

All of which operate an incredibly complex grid of high-voltage power lines that bring electricity to local utilities for distribution at low voltage to households and businesses.

The purpose in showing these maps is not to provide a detailed analysis of the system, but just to convey how complex the system is and to suggest that this may play a part in the apparently dysfunctional relationship between would-be providers of renewable energy and those 66 Balancing Authorities that need to approve new additions to the system.
And the system has become even more complex through deregulation, which has the intent of increasing competition in the marketplace. The companies that distribute the power are prohibited from producing that power. Before deregulation most electricity was generated and distributed through regulated monopolies.
Here is an interesting semantic complication that may capture how hard it can be to understand the system. The distribution of electricity in much of New England is actually managed by a company called National Grid, which is neither national, nor just a grid, and is in fact a private English firm that has recently expanded from the UK into the U.S. I find it intriguing that part of our electrical system in this region is owned and operated by a foreign company. National Grid has been embroiled in controversy in Rhode Island recently over a number of issues and appears to be divesting itself of many U.S. assets.
If one were looking for stability and managed growth in the electrical industry, this would not seem to be an optimal approach. The role of the federal and state governments in directing this complex system is generally limited to setting rules and goals and establishing financial incentives. New low-carbon installations, like wind and solar farms, need to deal with local zoning and land use approval processes as well.
International Comparisons
Another way of looking at the U.S. system might be to compare the outcome of the energy planning process in terms of the fraction of electricity generated from low-carbon sources, as most countries have the stated goal of decreasing the use of fossil fuels.
[As an aside, readers of this Substack site will have recognized my preference for graphics of the kind used here to convey major points. Some people tend to think in pictures instead of words, and I am one of those. So much information can be contained in a single image - like this one. I hope these are helpful to others as well.]

The extent to which different countries have achieved reliance on low-carbon sources of electricity varies widely, and you will notice that only the top low-carbon producers are included here. The U.S., for example, is not on this chart. In 2019, U.S. electric power was 7.0% hydro, 19.6% nuclear, 2.6% solar, 7.2% wind and 1.8% other for a low-carbon total of 38.1% - half of that as nuclear. Renewables other than nuclear are increasing at a fractionally high rate in the U.S., but from a very low starting point.
One thing that jumps out at me from this colorful graphic is that, despite all the emphasis on wind and solar, hydro and nuclear (the blue and green bars) remain the dominant low-carbon sources globally. The range of nuclear contribution (from 0% to 72%) is also striking.
Are there characteristics that describe countries at the top of this chart? Some are smaller countries like Norway and Iceland where abundant resources (hydro and geothermal respectively) have been organized efficiently at the national level to achieve nearly 100% reliance on low-carbon sources. In Denmark, that resource is wind off the North Sea which has been harnessed, again by a focused national program, to provide a significant proportion of national electricity.
France decided many years ago to invest heavily in nuclear power, which now accounts for nearly 72% of total generation in the country. Existing plants produce power in excess of national demand, and France is the world largest exporter of electricity. The entire system for producing and distributing electricity is owned by the French government.
Canada's relatively high reliance on low-carbon sources is driven primarily by the development of hydro power in northern Quebec through a federally owned Crown Corporation (Hydro-Quebec), a major exporter of electricity to the U.S. Other electric utilities are generally organized at the Provincial level, and most are also Crown Corporations operating as regulated utilities.
The German system is closer to the U.S. system in that private companies operate both the means of production and distribution. There has been some recent turmoil in this system as companies buy and sell assets, sometimes in response to legal actions, and as the country uses regulations and incentives to reduce nuclear and coal use and increase renewables. There are currently 4 private companies that operate the distribution system (the grid). Just last week, Germany shut down its last nuclear plants with the goal of replacing the energy they produced with renewable sources.
In the UK, distribution of high voltage electricity is handled by a single private company, National Grid (yes, the same company that owns much of the distribution system in the northeastern U.S.). Their webpage describes the UK's electricity system as "a complex machine with many moving parts." Electricity generation is dominated by six large, privately-owned companies. A recent government policy statement was focused on general goals with little indication of central direction toward those goals.
Both Germany and the UK are near the bottom of the list in the figure above, but are still ahead of the U.S. in terms of low-carbon electricity.
Countries with Well-planned Energy Systems and Abundant Resources Lead the Way
The pattern from the graphic above is that small countries with abundant renewable resources (Norway, Iceland, Denmark) or larger ones with strict central planning (France) have been most successful. While the U.S. has abundant renewable resources (especially solar and wind) it seems that the system for bringing these resources online is "gridlocked" at the local-to-regional level by the complexity of the system and perhaps by a lack of commitment to upgrading the grid commensurate with the incentives for building new generating capacity.
Vaclav Smil's view of energy systems seems to be close to the mark for the U.S. as change in our centralized, grid-based electricity system is happening very slowly indeed. But is there another form of capacity growth that could break the logjam? That is the topic for the next essay.
Sources
The graph on the growth in number of proposed connections to the grid is from:
https://emp.lbl.gov/sites/default/files/styles/maximage/public/queues_fig_2.png?itok=hIHVtbui
Graphs on the distribution and growth of electricity energy sources in the U.S. are from:
https://www.eia.gov/todayinenergy/detail.php?id=55719
The two books cited are:
Gates, B. 2021. How to Avoid a Climate Disaster. Alfred A. Knopf.
Smil, V. 2022. How the World Really Works. Viking Press
A recent article on the push to electric vehicles is:
https://www.nytimes.com/2023/04/12/climate/biden-electric-cars-epa.html
The article on the process for connecting new energy sources to the grid is:
Sources for graphics and maps on the U.S. electricity distribution system include:
https://en.wikipedia.org/wiki/Electricity_sector_of_the_United_States
https://www.publicpower.org/resource/americas-electricity-generating-capacity
https://en.wikipedia.org/wiki/North_American_power_transmission_grid
https://commons.wikimedia.org/wiki/File:NERC-map-en.svg
U.S. Energy Information Administration - EIA - Independent Statistics and Analysis
https://en.wikipedia.org/wiki/Regional_transmission_organization_(North_America)
https://en.wikipedia.org/wiki/Eastern_Interconnection
https://www.eia.gov/electricity/annual/html/epa_01_02.html
The marketing region image is from:
https://www.eia.gov/outlooks/aeo/pdf/nerc_map.pdf
The graphic on fractional production of electricity from low-carbon sources is from:
Kudos to the author of that graphic - Grant Chalmers - a Senior Functional Analyst at the University of Queensland, Australia, for making it available through the Creative Commons process.
https://tz.linkedin.com/posts/grant-chalmers_rstats-gt-energy-activity-7024157606655004675-Mlau
Additional sources on the electricity economy of different countries include:
https://en.wikipedia.org/wiki/Electricity_sector_in_France
https://en.wikipedia.org/wiki/Electricity_sector_in_Norway
https://www.iea.org/articles/norway-electricity-security-policy
https://en.wikipedia.org/wiki/Electricity_sector_in_Canada
https://en.wikipedia.org/wiki/Electricity_sector_in_Germany
https://www.bmwk.de/Redaktion/EN/Artikel/Energy/electricity-grids-of-the-future-01.html
https://www.nytimes.com/2023/04/14/world/europe/germany-nuclear-power-plants.html
https://www.exchangeutility.co.uk/news/the-big-six-energy-companies-uk/