The holiday and year end seasons seem to be times for making lists. Things to do, people to see, and then those new year's resolutions. Judging from what comes across the news feeds and links, "top ten" lists seem especially popular.
So maybe this is a good time to put together a list of top indicators of global change - numbers that describe trajectories for critical parts of the Earth system - key indicators of where we are and where we are headed in terms of our collective influence on the planet.
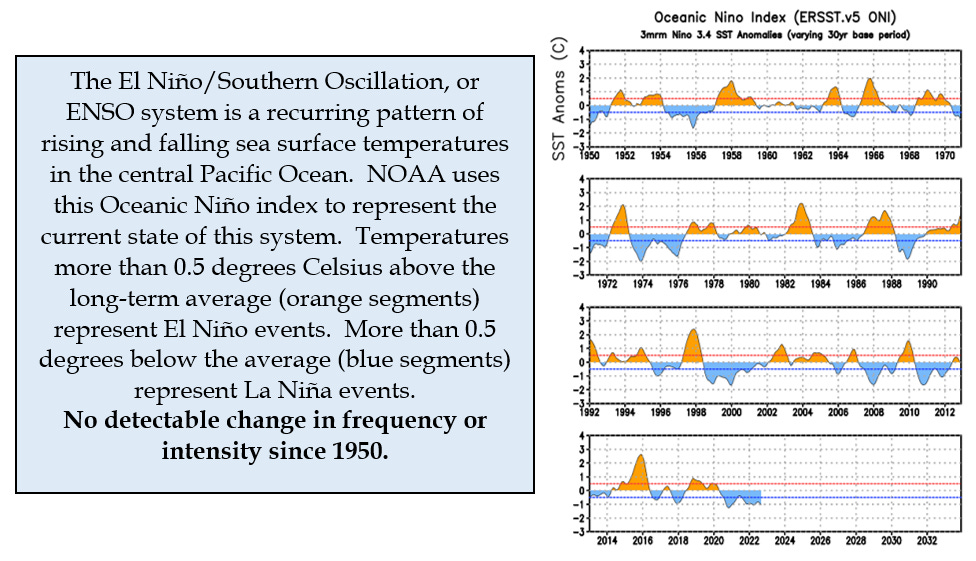
There are lots of popular indexes out there on nearly every subject. From the Dow Jones index for stocks, to the wind chill factor for temperature, to Wins Against Replacement for baseball players, indexes try to capture the performance or state of a complex system in a single number. In the climate system, NOAA uses a single measure of sea surface temperature in the central Pacific to characterize the current state of the complex interaction between ocean and atmosphere we call El Niño.
A good index is understandable and familiar, and represents something central to the subject at hand. In addition to conveying information effectively, a list of indexes like this one might also inspire conversation or even controversy! Why is that included? Why was this left out? With luck, this list will start some of those good conversations.
In selecting which indicators provide the clearest and most comprehensive windows into our impacts on the Earth system, one characteristic became very apparent. You don't really need to check the status of the ones on this list every day.
Individual disasters spawned by a warming world dominate the headlines, but while each storm or fire adds to the mounting evidence of our own domination of the natural processes of the Earth, stories driven by these tragedies often say little about ultimate causes or what might be done to forestall future ones.
In one sense then, this list is an attempt to escape the 24-hour news cycle because our most profound impacts accumulate slowly. They have also created momentum in the climate system that will be hard to reverse. Hard, but not impossible. While there are no quick fixes, we can still take steps now that will slow the momentum we have initiated. In the meantime, it seems wise to prepare for more of the storms, fires and droughts that are to come.
The success of any efforts we might make collectively to alter the path that our climate system is on will be reflected in changes in the indicators on this list.
That is a pretty heavy introduction to what I had envisioned at first to be a somewhat lighthearted play on the whole notion of year-end lists, but I guess that just shows that it is hard to frame global change in light or humorous terms.
So here is my list of top 12 global change indicators, with a little commentary as to why each was chosen and what each represents. Some will be obvious choices, but there might be one or two that are surprising, and might stimulate some discussion. Links associated with each will take you to the site housing the data set shown, so you can check them as often as you like (even knowing they won't change much day-to-day!). There are also links to previous essays that present additional background on some of the indicators. This recently released book provides a deeper historical and scientific look at each of these indicators.
#1 - The Keeling Curve of carbon dioxide concentration in the atmosphere
https://keelingcurve.ucsd.edu/
While carbon dioxide is not the only major greenhouse gas, it is the most important. Changes in concentrations of other major gases like methane and nitrous oxide, have historically tracked changes in carbon dioxide, making it a powerful index of human-driven impacts on the chemistry of the atmosphere. The measurements in the Keeling Curve are precise enough to capture the annual cycle of carbon metabolism of the biosphere - increasing concentrations in winter, decreasing in summer, but the climate change impact is in the continuous long-term increase.
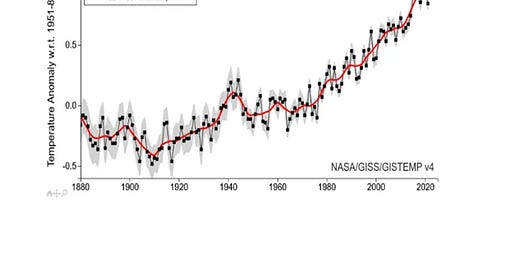
#2 - Global average temperature
https://data.giss.nasa.gov/gistemp/graphs_v4/
Global temperature is the first direct response to increasing greenhouse gas concentrations, and a primary driver of many of the indexes that follow. This global average increases almost every year (see #7 - El Niño), but the distribution of increase is not equal across the Earth. Most notably, temperature increases in the Arctic are occurring at about twice the rate of the global average.
#3 - Ice on the oceans - Arctic Sea Ice
https://climate.nasa.gov/vital-signs/arctic-sea-ice/
While melting of sea ice in the Arctic Ocean does not result in sea level rise, this data set emphasizes the long-term impact on ocean temperatures and captures an important feedback in the climate system. Ice reflects sunlight, minimizing temperature increases in the underlying sea water. Once the ice is gone, water absorbs almost all incoming sunlight, increasing the rate of warming of that water.
#4 - Ice on land - Glaciers and ice caps
https://climate.nasa.gov/vital-signs/ice-sheets/
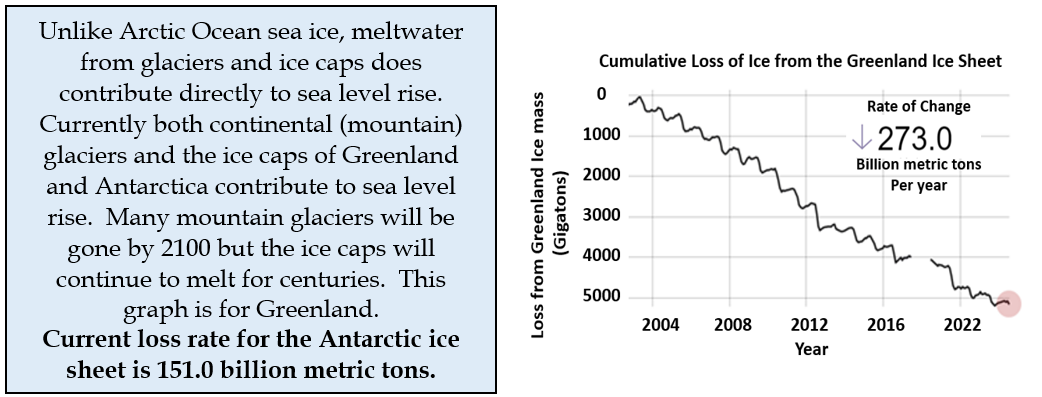
Net loss of ice from the Greenland ice cap has been relatively constant over the short 20 year period covered by this data set, but that rate is expected to accelerate as the Earth warms. There have been previous geologic eras with global temperatures similar to those predicted for our future. In those periods, ice was gone from Greenland and Antarctica, and sea levels were as much as 70 meters higher than now. That is the direction we are headed, and while it might take 200,000 years to get there, you get a sense of the momentum we have created in the climate system. Changes in water storage in mountain or continental glaciers, with the availability of a 60 year record, shows a consistent increase in the rate at which ice is disappearing.
https://wgms.ch/global-glacier-state/
#5 - Sea level rise
https://climate.nasa.gov/news/3030/rising-waters/
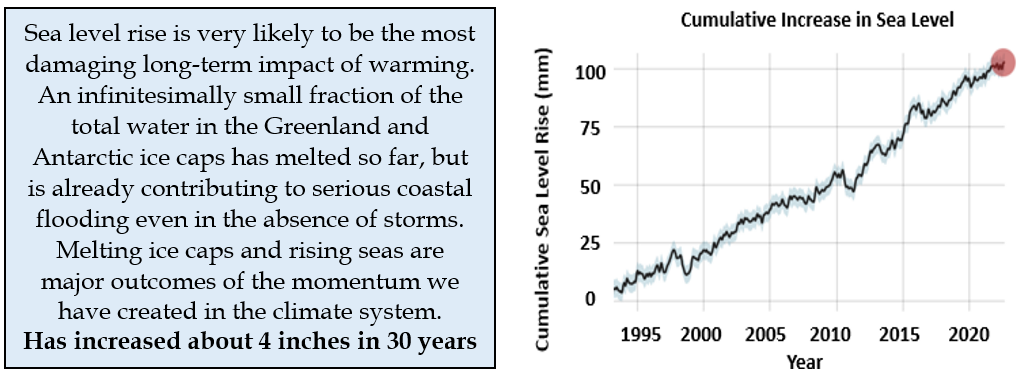
Sea level rise results from both the expansion of water in the oceans as they warm, and the contribution to total water content by melting of glaciers and ice caps. Currently about 60% of the rise is due to melting and 40% to thermal expansion (warming of the water). While most mountain glaciers will be gone by 2100, net water loss from Greenland and Antarctica will continue for centuries. Sea levels by 2300 could be 15 meters (more than 45 feet) higher than today.
#6 - The Gulf Stream - Atlantic Meridional Overturning Circulation
https://rapid.ac.uk/
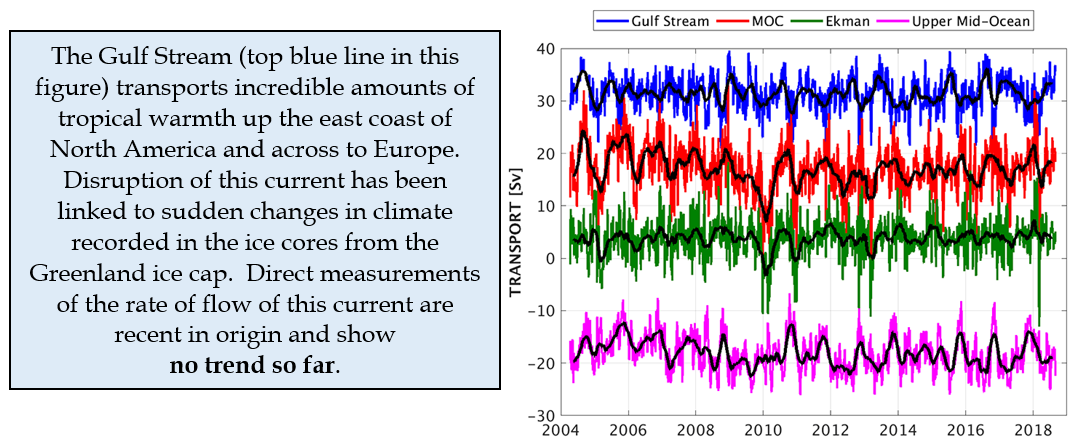
One Sverdrup (SV on the vertical axis) is a flow rate of more than 26 million gallons of sea water per second! Water in this stream cools and becomes saltier as it moves north, sinking between Greenland and Scandinavia. The Gulf Stream is one part of a larger circulation pattern called the Atlantic Meridional Overturning Circulation (AMOC) system, in turn part of the fairly recently described global cycle of ocean water circulation. The heat delivered by this current is crucial for the agricultural and economic health of northern Europe, making this data set a crucial indicator of change in the global climate system. While direct measurements of flow are relatively recent, reconstructions of temperature histories for the North Atlantic suggest that waters at the northern end of this ocean conveyor belt are lower now than 60 years ago, suggesting that the rate of flow is decreasing.
#7 - El Niño
https://www.cpc.ncep.noaa.gov/products/analysis_monitoring/lanina/enso_evolution-status-fcsts-web.pdf
The ENSO system is one of the best known of several climate oscillations that result in mid-term (seasonal to annual) variation in weather. The state of the system is determined by sea surface temperature anomalies (SST Anoms - Degrees Celsius). El Niño events (orange) are linked to increased rainfall in California and Peru, and fires and drought in Australia. La Niña events (blue) can lead to extended drought in Peru and increased rainfall in Australia. Swings in this index, and the energy balance of the Pacific Ocean, are enough to cause shifts in global annual temperature. Predicting the state of the ENSO system and several other regional climate oscillators is an active area of research. How they will respond to a warmer climate system, and how they will interact with each other, is not well known. That makes this index one that will be interesting to follow. There may be some surprises waiting here (including what happened in the winter of 2022-23!).
#8 - Population
https://data.worldbank.org/about/get-started
Global emissions of carbon dioxide (red line, right axis, billions of tons) have nearly doubled since 1970, despite significant increases in the carbon efficiency of economic activity (tons of emissions per $1,000 dollars, green line, right axis) as both the number of people in the world (blue line, billions, left axis) and economic activity per person (aqua line, $100s/per person, right axis) have increased. If this trend continues, whatever increases in the carbon efficiency of economic activity we make will be offset by increases in population. This graph was developed from several World Bank data sets.
#9 - Food production per capita
https://data.worldbank.org/indicator/AG.PRD.CREL.MT
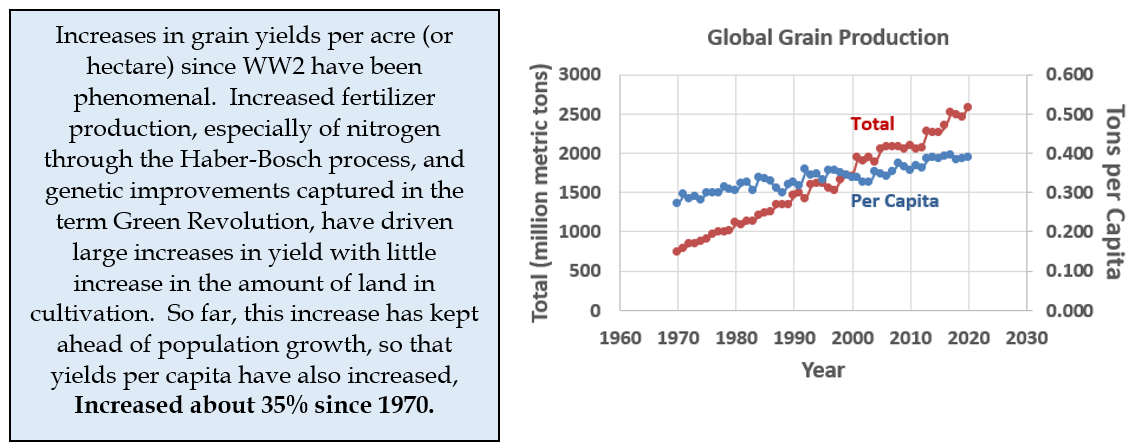
The invention of the Haber-Bosch process for converting inert nitrogen in the atmosphere to a form usable for producing nitrogen fertilizers has more than doubled the number of people that can be fed globally. With genetic improvements though crop breeding as part of the Green Revolution process, global grain yields have increased faster than human numbers. Will this trend continue? This is an important index to follow. If the ratio of food production to population declines, relieving food insecurity (already an issue in much of the world) will likely take increasing precedence over action on climate change. Again this is compiled from World Bank datasets.
#10 - The dead zone
https://www.noaa.gov/news-release/larger-than-average-gulf-of-mexico-dead-zone-measured
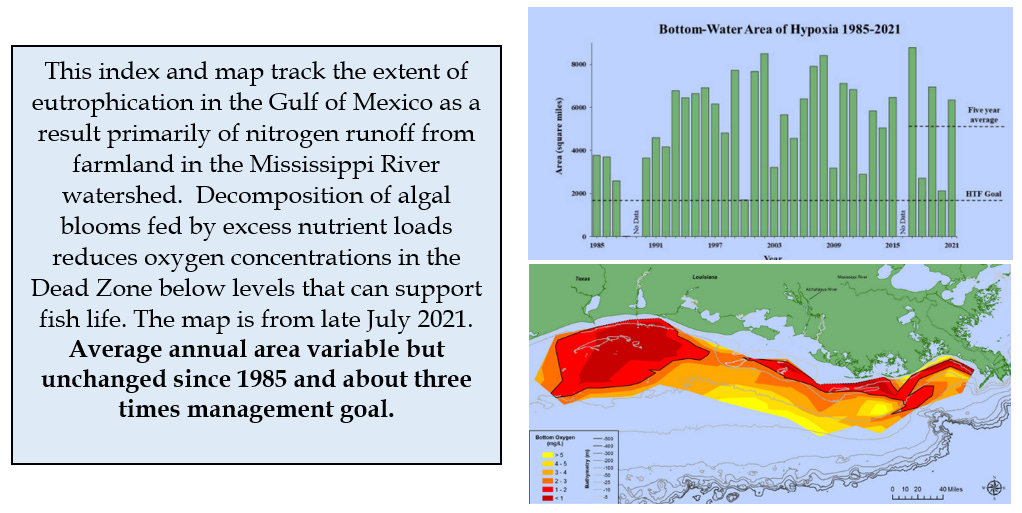
There are as many critics of the Green Revolution as there are supporters. Loss of biodiversity in crops and increased pollution resulting from overuse of fertilizers are just two of the issues raised. We know a lot about eutrophication resulting from nutrient pollution of waterways. Excess nutrient loading leads to excessive growth (blooms) of algae. When the algae die off, decomposition removes oxygen from the water column creating anoxic conditions (hypoxia) leading to the death of fish and other oxygen-demanding organisms. Hypoxia events occur at the mouths of several large rivers. This data set for the Gulf of Mexico is one that can be tracked. Success here, for example through increased efficiency of fertilizer use, might be reflected in other regions as well.
#11 Carbon Storage in Forests
https://www.fao.org/documents/card/en/c/ca9825en
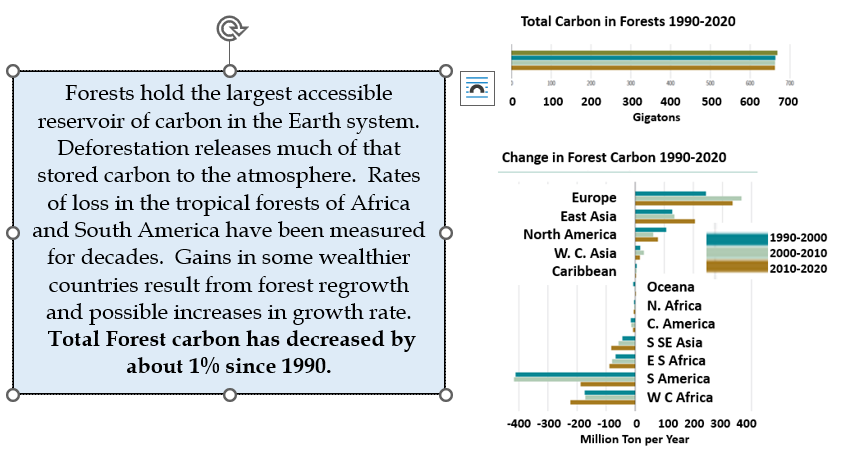
Deforestation, especially in the Amazon basin, has been a major focus of environmental concern and monitoring for several decades. Concerns over loss of biodiversity and carbon are foremost. On the other hand, measurements of intact forests, especially in the northern hemisphere, suggest that carbon accumulation in those forests is accelerating, perhaps due to longer growing seasons and some fertilization effect of increased carbon dioxide. The FAO numbers used in the figure capture both trends, but also rely on reporting by individual countries.
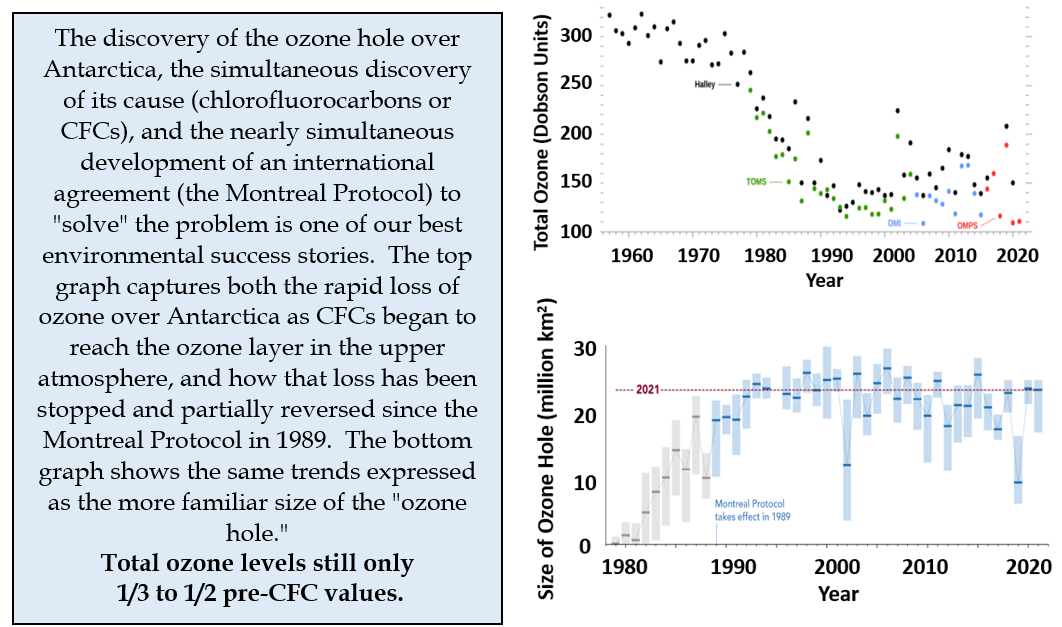
#12 - CFCs and the ozone hole
https://ozonewatch.gsfc.nasa.gov/facts/history_SH.html
https://www.noaa.gov/news/antarctic-ozone-hole-is-13th-largest-on-record-and-expected-to-persist-into-november
While the ozone concentrations over Antarctica in winter have stopped declining, the slow, continuous migration of previously emitted CFCs into the upper atmosphere will delay recovery. In recent years, there have also been reports of rogue emissions of CFCs from small-scale industrial activity in different parts of the world. This makes this index of interest relative to the world community's ability to control the emissions of industrial chemicals that affect global processes.
* * * * * * * *
So there is my list. Many others might be included, like disappearance of permafrost, trends in total energy in tropical cyclones, concentrations of other greenhouse gases, and changes in other important pollutants like mercury or lead. Still, I will keep watching these, and hope that you will think about and talk about other important global change indicators and processes.
