

Hurricane Ian - a "500-year" Storm?
Historically, a major hurricanes has hit Florida once every 4 years. Since 2004, there has been one every other year.


Hurricane Ian struck Florida in late September 2022, causing tragic loss of life and damage to property. Early reports suggested such a catastrophe was a “500-year” event, which is one way to emphasize the magnitude, but could also be turned around to suggest there is no need to prepare for another one, if it won’t happen for another 500 years.
This essay uses historical data to show that an Ian-like storm could be expected in Florida about once every 60-80 years rather than every 500. In 2024, Helene and Milton shifted those numbers.
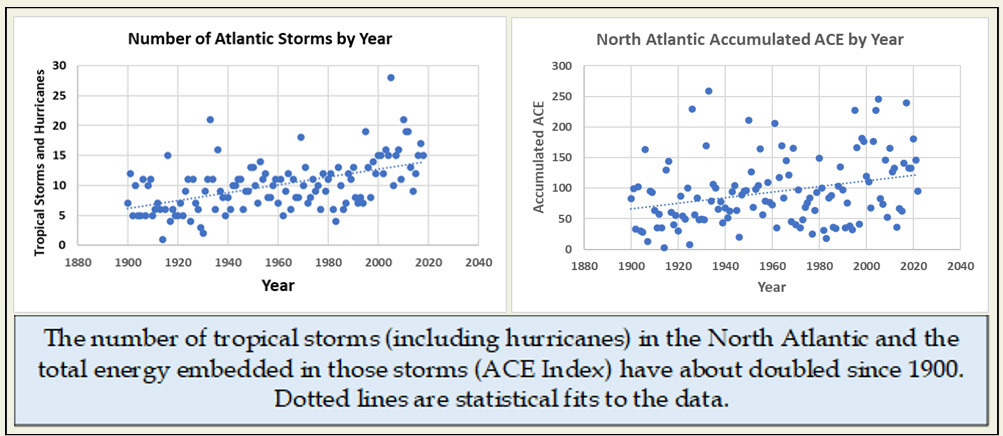
Both the number of hurricanes per year in the North Atlantic and the total energy embedded in those storms have just about doubled since 1900, adding to the urgency to prepare for the next Ian, or Helene, or Milton.
And it can be done. A following essay tells the story of one community that was designed to resist an Ian-like storm, and succeeded.

Rare and Tragic Storms – But How Rare?
This essay was originally to be about predictions for a superstorm said to be due in California soon - and how to predict the likelihood and intensity of rare, major events.
But Hurricane Ian made that more than a theoretical discussion. The devastation was overwhelming and the loss of life and property on a scale rarely seen. Some sources were quick to say that this was a "500-year" event, implying that we never could have predicted it, and really don't have to plan for the next one, because there won't be another one like Ian for another 500 years.

The use of the term is appropriate - the threat of a disaster of a given intensity is often described in terms of likely return time or expected frequency - but the data on hurricanes in Florida do not support that 500 number. And in the last month (September-October 2024), hurricanes Helene and Milton have reinforced the potential for recurring hurricane disasters to strike this most vulnerable state.
Estimating Frequency and Intensity
The simplest and most intuitive method for estimating likelihood of major disasters is to look at existing data on frequency and intensity of past storms and use those data to extrapolate into the future.
But what numbers should we use to characterize a hurricane? Disaster reports often focus on number of fatalities and total value of property damage, and those are clearly the most important in terms of the human tragedy. But those numbers are also affected to a large degree by population density and property values under the storm's track, numbers that vary widely from place to place and over time.
Ian was so tragic in terms of loss of life and property in part because it made landfall on a major city and also in an area with high property values. Much of that value was built on a set of very fragile and also thickly settled barrier islands (like Fort Myers Beach and Sanibel/Captiva).
If loss of life and dollars of damage are so affected by factors outside of the strength of the storm itself, what can be measured consistently and be used to judge trends in storm frequency and intensity alone?
The physical strength of a hurricane can be described by both category (the 1-5 scale we hear on the weather reports) and by maximum sustained winds at landfall (in knots - The marine designation for speed - one knot is 1.15 miles per hour). Ian was a category 4 storm (almost a 5) with sustained winds at landfall of 150 knots. Have there been other storms of similar strength?
The data set on this is managed by the National Hurricane Center, part of NOAA (National Oceanic and Atmospheric Agency), and analyzed through a project called HURDAT. An accessible list of hurricanes of category 3 and above that have hit Florida is available here. That list is used in the analyses that follow.
The Numbers
Since 1851, there have been a total of 41 hurricanes of category 3 and above (Florida landfall only). With a total record covering 174 years, the likelihood of such a storm is 41/174 or 23.6% per year. Divide 1 by this number (invert it) and the likely return time, or time between such storms, on average, is 4.2 years.
This table completes that calculation for category 4 and 5 storms - once every 10.2 years for category 4 and above, and once every 58 years for category 5. Much less than 500 years!
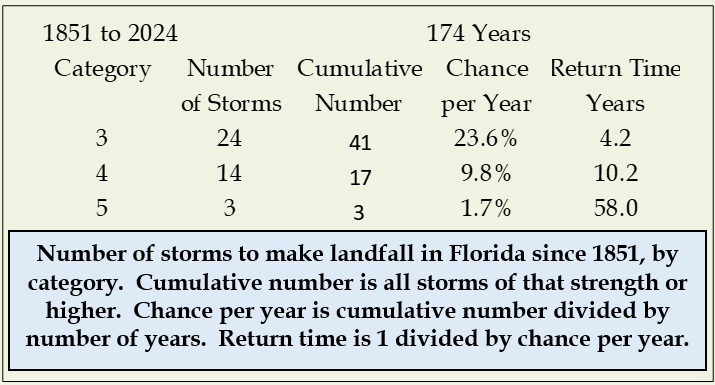
If you want to shorten the timeline to the last 20 years, there have been 11 storms to hit Florida at category 3 and above since 2004, or basically one every other year.
Data on maximum sustained winds at landfall are divided more finely, into categories by 5 knots between 100 and 160 knots. On this scale, Ian is the second strongest storm to hit Florida.
With more available data points, a graph can be drawn that shows the change in return time or frequency as a function of windspeed at landfall. Hurricanes with windspeeds of 105 knots and above (like Milton) should occur about once every 5-6 years. Storms up to 120 knots (like Helene) should occur about once every 21 years. Storms with sustained winds at landfall of 150 and above (like Ian) should occur somewhere in Florida about once every 85 years.

The inverse relationship between frequency and intensity seen in both of these data sets (frequency declines and time between events increases as intensity increases) is seen for almost all kinds of natural disasters (floods, droughts, etc.).
Frequency, Intensity, and Climate Change
And what of climate change? Reports often say that the frequency and intensity of hurricanes are increasing. The Florida data would support this. Plotting windspeed at landfall of each storm for the year in which it occurred, there is an upward trend, with average windspeed increasing over time from just over 100 knots to just over 120 knots (~ a 20% increase).

These numbers for Florida suggest a trend over time, but a clearer picture can be derived using figures for all tropical storms in the North Atlantic. Numbers are available for both the total number of storms and what is termed Accumulated Cyclone Energy, an index based on wind speed and duration that approximates the amount of energy released in all storms that occur in one hurricane season.
Both of these measures have nearly doubled over the last 120 years.
Impact of Rising Sea Levels
Increasing storm frequency and intensity will also build on a continuous rise in sea level.
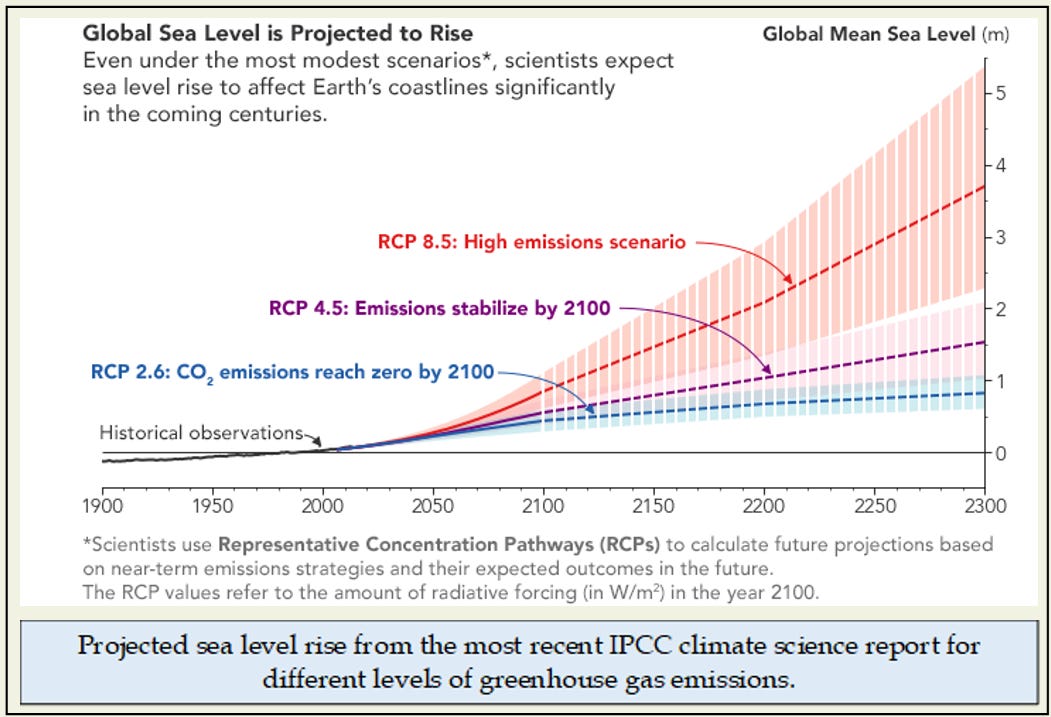
A NASA site presents this image of projected sea level rise through 2300. The range of projections for 2100 cluster around 1 meter or about 3 feet.
NOAA has constructed an interactive site that allows the visualization of the impact of different amounts of sea level rise on coasts, harbors and estuaries around the U.S. For Florida, a 3 foot rise in sea level will put much of Ft Myers Beach, Sanibel Island, Miami Beach and Fort Lauderdale under water, with substantial additional areas subject to high tide flooding, even without storm surge.
The NOAA maps do not include the Everglades National Park, but the National Park Service has mapped likely submergence over time. With a 3 foot rise, much of the park and its infrastructure would be underwater in 2100.
None of us will be around for the projected rise by 2300 pictured in the NASA figure, but somebody will, and so will some of the infrastructure we build now in cities and communities. For those future generations, it may be worth considering even the 2300 projections. The range of 1-5 meters (about 3 to 16 feet) in total sea level rise by that date suggests just how much we can still control the future if we choose to limit greenhouse gas emissions, and also shows the magnitude of the future challenge if we don’t.
The tragedies caused by hurricanes and other natural disasters rightly fix our attention on the immediate need for aid to those affected. Often lost in the aftershock is what might be done to either mitigate or prepare for the next one. Claiming a 500-year return time argues against doing much of either. The actual data capturing the history of past storms for Florida suggests another Ian should happen somewhere in Florida every 80 years or so, and another Helene every 10-20 years. The return time for all storms of category 3 or higher is once every 4-5 years.
Given the trends in storm frequency and intensity over time, we might expect those estimates to be conservative. Rising sea levels will increase flood damage at each level of storm intensity.
Using existing information to predict the actual likelihood of hurricanes of different intensities might help decision-making about how to prepare for the next Ian or Helene or Milton. One can imagine changes in evacuation procedures, and in city planning, zoning, and building codes, but politics and policies are beyond the scope of these essays.
However, one successful example of preparedness will be presented in the next essay.
Whatever steps toward recovery are taken following the devastation of Ian, Helene and Milton, and all of the 11 major hurricanes to hit Florida in the last 20 years, we can only hope that those decisions will be based on an accurate assessment of the future frequency and intensity of major storms.
Sources
Data on hurricane occurrence and strength are accumulated by NOAA's National Hurricane Center:
https://www.nhc.noaa.gov/
An accessible listing of Florida hurricanes, and the one used in these analyses, can be found here: https://en.wikipedia.org/wiki/List_of_Florida_hurricanes
The HURDAT project is described here: https://en.wikipedia.org/wiki/HURDAT
The Accumulated Cyclone Energy (ACE) database is described here: https://en.wikipedia.org/wiki/Accumulated_cyclone_energy
And the data are available here: https://psl.noaa.gov/gcos_wgsp/Timeseries/Hurricane/hurr.atl.ace.data
Projections of future sea level rise for different greenhouse gas emission scenarios in the final figure here are based on a figure on page 80 in the most recent IPCC report: https://www.ipcc.ch/report/ar6/syr/downloads/report/IPCC_AR6_SYR_LongerReport.pdf