

Poking It With Sticks
Is the Rate of Sea Level Rise Increasing?

“The climate system is an angry beast and we are poking it with sticks.”
There has been no shortage of credible scientists who have foretold the rapid changes in the climate system that we are now experiencing.
Wally Broecker was one of the more adamant and out-spoken in that long line. The quote above from Dr. Broecker is captured in an article in the New York Times in 1998. Broecker is also credited with saying that the climate system is weird and volatile, and that nature tends to over-react to change, a wonderfully evocative way to capture the importance of positive feedbacks, or self-augmenting processes in nature. Once a change is initiated, that change causes other changes that amplify the original change.
Others warned us long ago of the coming challenge. James Hansen at NASA declared in front of a congressional committee in 1988 that climate change was real and happening now (meaning then). Going back even further, Roger Revelle cautioned us in 1957 that we were running an experiment at the global scale on the only Earth we have, saying “human beings are now carrying out a large scale geophysical experiment of a kind that could not have happened in the past nor be reproduced in the future.”
Quantitative estimates of just how much we might warm the Earth have also been around for some time. Let’s trace the time line on estimates of what is called “climate sensitivity to carbon dioxide.” This is an estimate of how much the average temperature of the atmosphere would change with a doubling of that greenhouse gas.
Working backwards, the latest IPCC science report from 2021, capping a 30 year period of research and synthesis, has reaffirmed what we have known for decades: that we are changing the climate system. It also put climate sensitivity to carbon dioxide at 3C (3 degrees Celsius).
Hitting just a few of the highlights from the era prior to the first IPCC assessment in 1990, a full review of climate change research by a panel convened by the National Research Council in 1979 reported a range of 2-3.5C for this sensitivity, and concluded they could find no missing factors that might change that conclusion. Back in 1975, Manabe and Wetherald had developed a three-dimensional global climate model that gave a roughly accurate representation of the current climate. Doubling carbon dioxide in the model's atmosphere resulted in a 2.3C rise in global temperature (In 2021, Syukuro Manabe was awarded the Nobel Prize in physics for his long-term commitment to modeling the climate of the Earth).
And we can go back farther still. Gilbert Plass used a simpler model and in 1956 estimated this sensitivity at 3.6C.
But my favorite is Svante Arrhenius, another Nobel laureate, who used very basic information on the absorbance of infrared radiation by carbon dioxide in a year-long series of grueling hand calculations to predict the impact of a doubling of this greenhouse gas on temperature. The year was 1896. His conclusion: 4C. Not bad for 125 years ago. And he drew on measurements made by John Tyndall who was one of the first to posit, around 1860, that the climate of the Earth was “conditioned” by the atmosphere.
So we have known for more than a century that increasing carbon dioxide in the atmosphere will increase temperatures, and by roughly how much. Why there is even a question about this in the public discourse on climate change is a question for the politicians and policymakers, not the scientists.
So it can’t be said that we didn’t know what was coming.
And the surest and most challenging of conclusions on the impacts of global warming, to my mind, is that sea levels will rise. The question is: How fast?
These musings, and this essay, were stimulated by a couple of recent reports of extreme events in the two places most closely linked to sea level rise: Greenland and Antarctica. The massive ice sheets on these two landforms contain 91% of the fresh water on the planet, and, if melted, could raise sea level by about 66 meters (200 feet).
Extreme events tend to grab the headlines, while the detailed calculations and predictions out of the kind of reports generated by the IPCC and by U.S. agency like NASA and NOAA tend to defy media presentation. These agencies fill an incredibly important role in both acquiring data on the key drivers and responses of global change, and also by making those data available to the public and to independent researchers.
Let’s look at some of these recent reports and then look for evidence that we are poking the system with sticks that could increase rates of change.
The first recent report is that rain happened last summer at a point more than 10,000 feet above sea level in the heart of the Greenland ice sheet. Rain may not seem like an unusual event, but at that elevation in that location, it had never been recorded prior to 2021. That same summer also saw above freezing temperatures later in the year than previously measured.
An increase in melting events was also reported out of Greenland. These occur when surface ice melts, creating rivers of flowing water that carve through the remaining ice in a series of caves and channels, increasing both surface and deep melting. Liquid water can also lubricate the boundary between ice and rock at the bottom of the ice sheets, reducing friction and accelerating rate of movement toward the sea.
For Antarctica, recurring stories relate to the breakup or collapse of major ice floes that can be found on many websites. But this year some major weather events occurred as well. One station recorded a first ever above-freezing temperature, while another clocked the warmest March in recorded history. NASA also reported a record low coverage for floating sea ice around this critical continent.
Are these harbingers of a change in the rate of ice melting? The answer does not lie in individual extreme events, but in the kind of recurring monitoring of annual flows that usually fails to grab media attention.
In a previous essay I looked at reports of what sea levels were the last time the Earth was as warm as it will be by 2100. Using 2C and 5C as the high and low estimates for global temperature increases, we needed to look back 4 and then 40 million years. In those geologic eras, sea level was 20 and then 70 meters higher than now.
The symmetry here is clear. We are headed into an era of continually rising sea levels, and the end point of the process is not something anyone would want to contemplate. We can only be thankful that there is incredible inertia in the ice melt process that will prevent such massive increases in sea level within a human time frame. For just how long we will get to in the “fun with numbers” section below.
Through a series of modeling exercises, the most recent IPCC report predicts increases in sea level between one half and one full meter, depending on what we do about greenhouse gas emissions, rather than 20 to 70 meters. But just how fast are we losing ice in Antarctica and Greenland, and is that rate accelerating? And what is the comfort level relative to how long it might take for all the ice to melt?
As part of its critical role in providing solid measurements of major global change indicators, NASA has brought the key data on this question together in a single site. As information provided by a government agency, it is immediately in the public domain, so that the graphics can be included here. This one site answers our question about changes in the rate of sea level rise and of ice loss from Greenland and Antarctica, but an attempt to reconcile this set of measurements provided me with a surprising conclusion.
First, the NASA data. Quickly and graphically summarized, rates are presented in one banner headline and a series of graphs which all show the same trend. Total increase in sea level is 3.4 mm per year, including 2 mm due to increased ocean mass (meltwater) and 1.2 mm due to expansion from increased water temperature. Average rates of water loss, in gigatons, are given for Greenland and Antarctica.
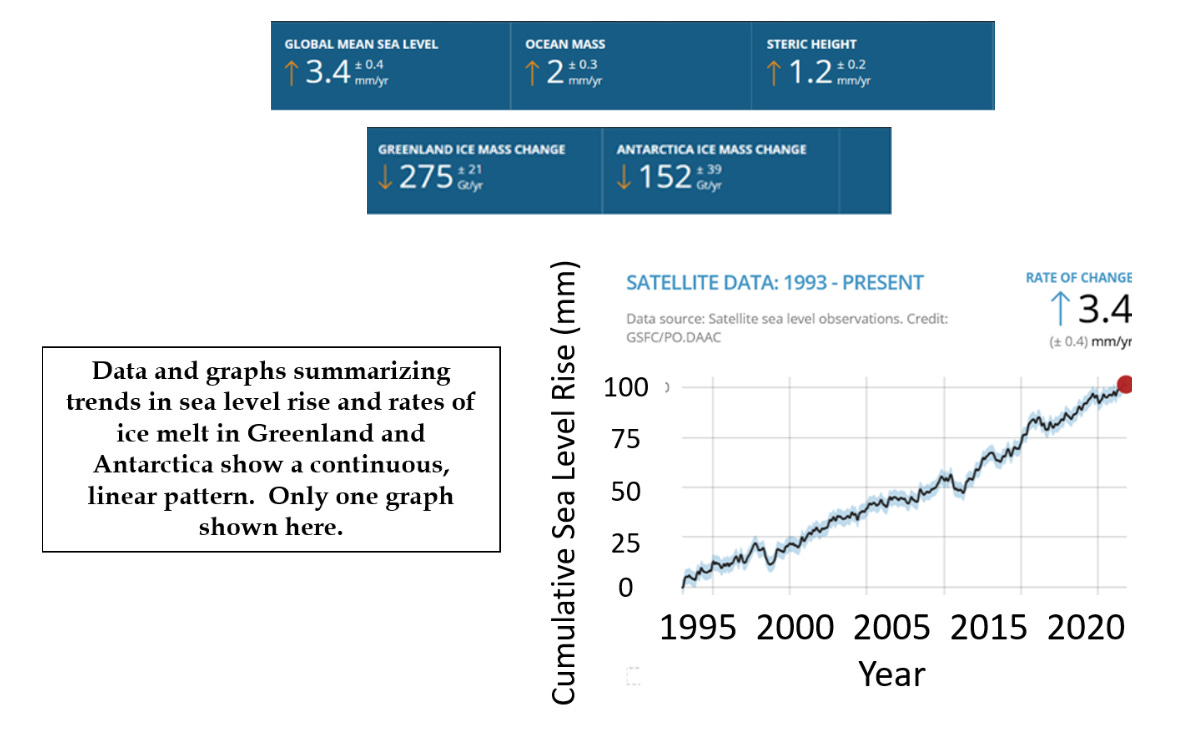
A simple answer to our poking the stick question is that the graphs for all of these variables are linear, meaning that rates are consistent from 1993 for total ocean water, or from 2002 for the two big ice masses (only showing one graph here, you can find the rest on the website). So we appear to be just nudging the climate system rather than poking it into a massive positive feedback loop – so far.
It should be noted that the Science report out of the IPCC Sixth Assessment takes ice loss back further in time and suggests that rates have indeed increased since 1990, with a turning point around 2002, when the NASA data here begin.
Interestingly, and here comes my surprise, if you apply standard values for increase in sea level per unit of melt water, the estimated increase due to the current rates of melt for Greenland and Antarctica sum to about 1.2 mm per year, rather than the 2 mm attributed to change in ocean mass.
Where is the rest of the water coming from?
I should have remembered that, in an earlier essay, I cited a recent paper with Thomas Frederikse as first author that solved this riddle. The answer: land based glaciers outside of Greenland and Antarctica.
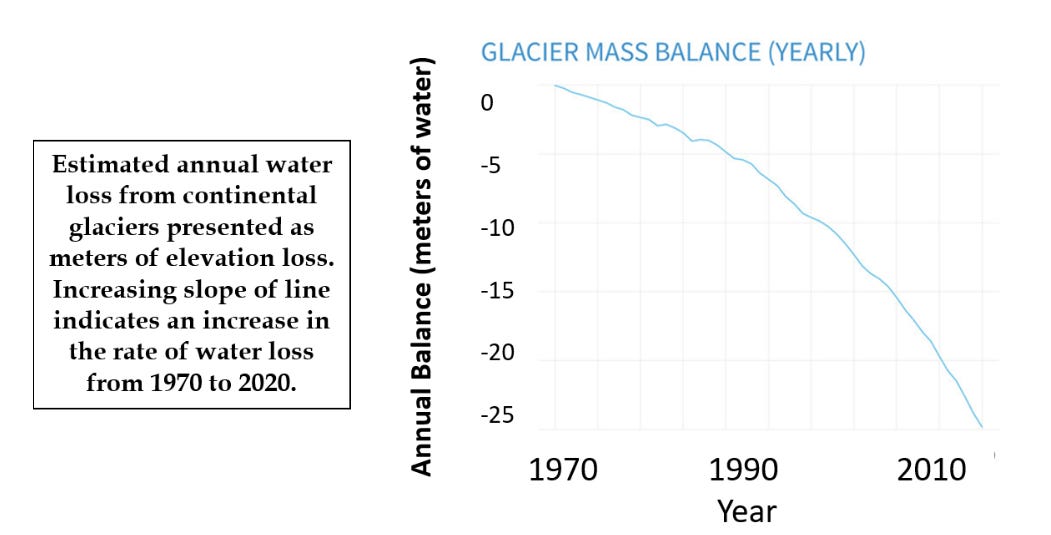
Dr. Frederikse graciously sent me this usable graphic that reconstructs contributions to sea level rise from several sources including continental glaciers. Without going into too much detail, the surprise to me was that until very recently, continental glaciers (Rocky Mountains, Alps, Himalayas) were a bigger source of water to the oceans than either Greenland or Antarctica (steeper slope to the lines). Looking back to 1900, glaciers have provided ~80 mm of what has been a cumulative ~200 mm of sea level rise.

This sent me on a search to see how much water was left in these ice forms and when they might be exhausted. I could not find the number, but glaciers are retreating at record rates worldwide and many news sources suggest that they might well be gone by 2100. Anecdotal stories from treasured locales such a Glacier National Park support that general conclusion. This might suggest a pause in sea level rise near the end of the century, if, as shown above, Greenland and Antarctica remain relatively constant sources of meltwater.
On the other hand, it is both logically and scientifically credible that greater warming will lead to faster melting of those big ice sheets and faster sea level rise. And sea level rise due to melting will also be augmented by increased ocean temperatures, as higher temperatures in the atmosphere are transferred to the oceans, causing thermal expansion. One report suggests that 90% of the increase in warming caused by increased greenhouse gas concentrations has been transferred to the oceans – another source of inertia slowing surface temperature increases that gives us some time to prepare for what is coming.
While there must be an upper limit to how much water can be released from continental glaciers, recent data show that the rate of meltwater provided to the global oceans from this source is actually still increasing.
Ok - Time to wrap this up with the “fun with numbers piece.” Just how long will it take for all of the ice in Greenland and Antarctica to melt? Assuming rates remain the same, here are the results:
Ice sheet Greenland Antarctica
Mass of ice 2,850,000 26,500,000 Gigatons
Rate of Loss 275 152 Gigatons/year
Time to disappearance 10,364 174,342 years
If there is some comfort in those numbers, we might still return to Dr. Broecker’s question about the stick and the angry beast. It may well be too early to answer that question. Let’s hope that the relatively conservative predictions from the IPCC about the rate of sea level rise hold. If so, these numbers would suggest we have some time to prepare for the harsh results that will inevitably ensue.
The first and absolutely essential step is to acknowledge that the climate is changing and that sea level rise is indeed inevitable. The tragic impact on coastal cities worldwide of even a 1 meter rise in sea level is hard to fathom. We can modify the rate of rise by controlling greenhouse gases, but we need to be ready to respond to this inevitability by preparing to either resist it or to repair the resulting damage. Either will be expensive.
Perhaps preparing to meet the challenge in advance would result in fewer dramatic headlines, but also less human suffering.
Sources
Stories about Wally Broecker include:
https://nationalmedals.org/laureate/wallace-s-broecker/
https://www.theatlantic.com/magazine/archive/1998/05/a-special-moment-in-history/377106/
And about Roger Revelle:
https://en.wikipedia.org/wiki/Roger_Revelle#cite_note-REVELLE_SUESS_1957_pp._18%E2%80%9327-5
The 1957 paper is:
Revelle, Roger; Suess, Hans E. (1957). "Carbon Dioxide Exchange Between Atmosphere and Ocean and the Question of an Increase of Atmospheric CO2 during the Past Decades". Tellus. Informa UK Limited. 9 (1): 18–27. Bibcode:1957TellA...9...18R. doi:10.1111/j.2153-3490.1957.tb01849.x. ISSN 0040-2826. (Manusript received September 4, 1956).
A summary of this history of “climate sensitivity to carbon dioxide” can be found here:
https://en.wikipedia.org/wiki/Climate_sensitivity
Water in Greenland and Antarctic ice caps is presented here:
https://nsidc.org/cryosphere/quickfacts/icesheets.html
News stories from Greenland include:
https://www.npr.org/2021/08/20/1029633740/rain-fall-peak-of-greenland-ice-sheet-first-climate-change
http://nsidc.org/greenland-today/2021/08/large-melt-event-changes-the-story-of-2021/
http://nsidc.org/greenland-today/2021/08/large-melt-event-changes-the-story-of-2021/
And from Antarctica:
https://earthobservatory.nasa.gov/images/149627/antarctic-sea-ice-reaches-record-low
https://www.cbsnews.com/news/antarctica-record-shattering-warmth-historic-event/
https://www.nytimes.com/interactive/2021/12/13/climate/antarctic-climate-change.html
The NASA site for information on sea level rise and major ice sheets is:
https://sealevel.nasa.gov/
The paper by Frederikse, et al. is here: https://www.nature.com/articles/s41586-020-2591-3
And the preferred citation is: Frederikse, T., Landerer, F., Caron, L. et al. The causes of sea-level rise since 1900. Nature 584, 393–397 (2020). https://doi.org/10.1038/s41586-020-2591-3
And data on water loss from continental glaciers is here: https://www.climate.gov/news-features/understanding-climate/climate-change-glacier-mass-balance