

The Climate Future of the U.S. and How We Might Change It
The Fifth National Climate Assessment predicts how changes in global temperature will affect weather, climate, safety, and economic health across the nation

The most recent essay in this series talked of cognitive dissonance on climate change – that while all the scientific studies show conclusively that the climate is changing, our collective progress in addressing the impacts of that change is slow. A recent polls suggest that only about 54% of the U.S. public sees climate change as a serious threat, and it ranks far behind the economy and the cost of health care as major concerns.
And then there are the contrarian “experts.” Just this week, a story resurfaced of yet another Nobel-laureate physicist who claims to know that climate change is a hoax. Included in this site is an imaginary exchange I think many climate scientists would enjoy having with such a denier.
Sadly, there is a long history of a small number of well-known physicists denying major findings in the fields of environment, climate, and health, and wielding much more influence than they should. Merchants of Doubt by Oreskes and Conway tells this sad tale in detail.
If a lack of information lends any comfort to the deniers, there is a new and powerful document that will increase their discomfort, at least in the U.S.
The Fifth National Climate Assessment was released on November 14. While there is little new science in this report – after all we have known the basics of climate change for decades – it does set a new standard for graphic display and interactive accessibility. Our current climate condition and future options for mitigation and adaptation are presented in detail and with clarity.

The complete document must run to thousands of pages – in the old meaning of printed hard copy - and millions of words, but the major points are clearly presented in the Overview section. More on those points in a minute.
Perhaps the most concise and highest impact link is to a single site that contains all of the figures used in the full report. If you like to think in images instead of words (I do), then this link provides a consistent format and message: Everything related to weather and climate is changing, has been changing for some time, and will continue to change in the future. And the changes are not due to random climate variation, but are directional and in response to warming at the global level.
The report also shows positive ways forward by which we can reduce the coming impacts, and presents some items cited as good news as well.
The most powerful interactive site embedded in the report is a little hard to find. With a separate address, an interactive atlas presents key climate indicators and how they will change given different levels of global increases in temperature (interestingly, there is no time frame given, just the degree of global temperature increase).
The Atlas is here. This link will take you to a blank map of the U.S. Clicking on “Open Map” will bring up a set of topics you can explore. Clicking on a topic will reveal the map, and then selecting “Map Layers” will reveal 4 options – increases of 1.5, 2, 3 or 4 degrees Celsius global temperature increase. You have to click on the small eye icon in the upper right corner of each map to display it. Select one of the four at a time for best display. You can drag the map to the left to get it out from under the layers legend.
There are other features, like a “sweep” function that lets you compare two maps in the same frame. The best way to learn about these features is through this video.
(NOTE: If these links don’t work, search for “fifth national assessment interactive maps.” There should be a box that says “Open the Explorer” at the bottom of the resulting page.)
As with other large-scale, synthetic reports on climate, updates have been issued on a roughly 5-year rotation. Previous reports in this series were released in 2000, 2009, 2014, and 2017/18.
Also as with other large synthetic reports, this one draws on the expertise of a large number of scientists – more than 750. Getting that many scientists to agree on anything is a challenge, and such a consensus should not be vulnerable to the contrarian notions of a few non-expert physicists. The success of the report in achieving this level of agreement enhances its credibility (disclaimer – I was not involved in this process).
The existence and presentation of this report are the biggest news items to report here, as the conclusions have been stated and restated countless times over at least the last 35 years, if we choose to begin with James Hansen’s report to congress in 1988. The first scientific paper accurately linking increased carbon dioxide in the atmosphere to increased global temperature actually appeared in 1896, authored by Nobel-laureate physicist Svante Arrhenius. His findings were summarized in a book for general audiences in 1908.
Still – those conclusions bear repeating once again, and we can borrow a few of the more dramatic images from the assessment to drive home the major points.
The report actually begins on a somewhat upbeat note. While temperatures across the nation have been rising steadily since 1965, and faster than the global average due to our relatively northern location, much has already been done to reduce greenhouse gas emissions. Still, the dashed line in the image on the right below presents the challenge ahead if the U.S., as a nation, is to reach zero net greenhouse gas emissions by 2050.

The report notes that the reduction in emissions has come despite increases in population and economic activity per person. A previous essay in this series presented similar numbers at the global level. Reduced costs and increased installations of low-carbon energy sources, along with increased use of electric vehicles, underlie these trends.

As a final upbeat message, the report summarizes by state the number of steps taken to either mitigate climate change by reducing emissions or adapt to the impacts of a changing climate system. These include actions taken below the state level by towns, cities, and regional agencies, and attests to the wide-spread realization, at the operational level, that important changes are already happening.

Following this relatively positive set of findings are the more troubling stories we are now used to hearing. Our lack of urgency in responding to these threats is at the heart of our cognitive dissonance.
These stories are so common now that they will only be highlighted here. They include
· Greenhouse gases are now at levels that have not occurred for more than 800,000 years.
· The cost of extreme weather events is rising rapidly
· Harmful Impacts will increase in the near term and differ by region
· Flooding and sea level rise pose threats to water supplies
· Food production and distribution will be disrupted
· Home and property damage will increase due to storms, fires, and sea level rise
· Fires and floods will damage infrastructure and communities
· Ecosystems are changing – natural resources are threatened
· Traditional and indigenous cultures are threatened
· All impacts and threats are being felt most strongly in disadvantaged communities
Three major categories of change are summarized in one figure capturing predictions for different levels of global temperature increase.

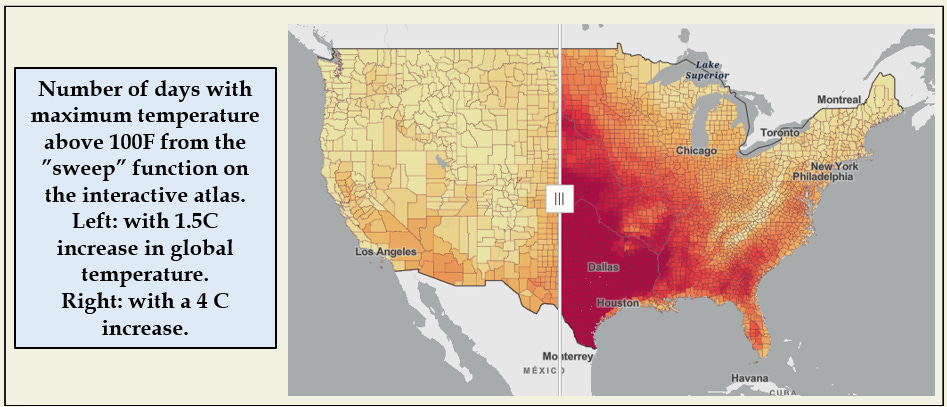
Sometimes maps convey a message more vividly, and allow viewers to put predictions into their own local context, and this is where the interactive map site allows that local focus.
Here is just one example. This image was generated using the “sweep” function to compare two different scenarios and is for change in number of days per year with maximum temperatures above 100 degrees Fahrenheit. The line between the two data sets can be moved left or right to reveal different regions (not on this image, but on the maps site). The two scenarios are for global warming of 1.5 degrees Celsius (left) and 4 degrees Celsius (right).
The Overview concludes as it began, with a moderately positive message: Much can be done to mitigate (reduce) the rate of climate change. A number of strategies are offered, all summarized relative to the proposed timeline to zero net emissions of greenhouse gases by 2050. And there are net gains in employment and economic activity to be realized by taking aggressive steps to increase the electrification of the economy and increase renewable or low-carbon sources of electricity.

Several essays in this series have made this same point. We are awash in solar energy, far beyond our energy needs. We lack only the determination to make it happen and the commitment to the investments required.
The Overview section of this Fifth National Climate Assessment concludes with this clear and uncontestable statement:
Adequately addressing climate risks involves transformative adaptation
One could add “and mitigation” to this statement, but the emphasis is really on “transformative.” Now is the time to build on the good work that has been done so far and accelerate the rate of change in the nation’s energy and economic systems.
Sources
The full results of that recent poll of U.S. attitudes about climate change are here:
The full citation for Merchants of Doubt is:
Oreskes, N and E. Conway. 2010. Merchants of Doubt. Bloomsbury Press. NY
The Overview to the Fifth National Climate Assessment is here:
https://nca2023.globalchange.gov/#overview
The online atlas tool is here:
https://atlas.globalchange.gov/
Click on the “open the explorer” box at the bottom of this page or go directly to the maps:
https://www.arcgis.com/apps/instant/atlas/index.html?appid=abf66b78b1dc47b192b15f07fb84de34
A video on how to use the interactive maps is here:
https://mediaspace.esri.com/media/t/1_m3iem21y
A history of previous National Climate Assessments is here:
https://en.wikipedia.org/wiki/National_Climate_Assessment
Here is one of the many articles written on the 30th anniversary of Hansen’s report to congress:
https://yaleclimateconnections.org/2018/06/judgment-on-hansens-88-climate-testimony-he-was-right/
The 1908 book by Svante Arrhenius is:
Arrhenius, Svante. 1908. Worlds in the Making. Translated by H. Borns. New York: Harper and Brothers.
The graph of temperature change is figure 1.5 in the Assessment Report. The graph of emissions is figure 32.1.
An interesting article presenting data for all countries on the current use of fossil fuels and renewable resources in the production of electricity is here:
The image of trends in costs and capacities for low-carbon energy is figure 1.2 and the graph of changes in drivers of greenhouse gas emissions is figure 32.2 in the Assessment report.
The bar graph summarizing by state steps taken to mitigate or adapt to climate change is figure 1.3 in the Assessment report.