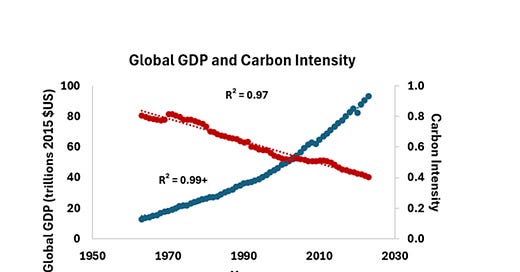
A final pledge I made at the end of the this run of essays was to occasionally update the interactive, Excel-based archive containing publicly available data sets relative to global change. Embedded here is an updated version of that file. It includes some recently added numbers but also has improved graphs that are used in the other message posted today. While that other message looks like an essay(!) it is intended really as a guide to this data set and the graphics contained therein. The consistency in rate of change over 60+ years in almost all of the indicators highlighted in that not-an-essay became apparent while compiling the data set.
Here is the updated file.


