

Why Carbon Dioxide Concentration Predicts Increases In Global Temperature
And when it might not


The first essay posted to Less Heat More Light presented a simpler way to demonstrate the relationship between carbon dioxide and temperature. This second posting focused on how greenhouse gases alter the energy balance and temperature of the atmosphere, and why carbon dioxide concentration alone is so strongly related to increases in global temperature.

Carbon Dioxide as an Indicator of a Changing Climate System
Last week’s essay on Climate Change in Four Easy Steps proposed that the atmospheric concentration of carbon dioxide alone was an excellent predictor of past and future changes in global average temperature. All the data from direct measurements of both carbon dioxide and temperature support this conclusion. One goal of presenting that analysis was to show that the basics of climate change are relatively simple and have been known for many decades.

On the other hand, any website or report on climate change will quickly get into the numerous changes in the chemistry of the atmosphere that result from agriculture, industry, energy generation and transportation. They are many and complex. They are real and need to be researched in detail.
Isn’t this contradictory? If carbon dioxide alone is such a good indicator, why not just concentrate on understanding and reducing emissions of carbon dioxide?
The key here is understanding how changes in the atmosphere affect temperature, and the nature of an indicator, or index.
What is an Index?
An index is a simpler way of summarizing a more complex system. For example, the Dow Jones Industrial Index, the NASDAC index and the S&P index might differ slightly on a given day, as they track different components of the financial system, but they tend to move in the same direction over time, reflecting similar overall trends.
On a hot summer day, the “heat index” summarizes the interactions of temperature, humidity and other factors on how the day feels to you. The “wind chill” index summarizes the complex of factors controlling how fast your body will lose heat on a cold winter day.
An index is never complete or perfect – it is a useful or convenient simplification, often produced to help convey the most important parts of a more complex interaction. Later in this essay we’ll encounter a hypothetical situation where carbon dioxide might no longer be that useful index for climate change, but first, something on why it has worked so well so far.
Greenhouse Gases and the Greenhouse Effect
The terms “greenhouse effect” and “greenhouse gas” have been criticized as imperfect analogies for the physical processes involved. Svante Arrhenius employed the analogy in the late 1800s (although he called it the “hothouse effect”), and the term is now permanently embedded in the lexicon of climate change. So are the conversations on the imperfect nature of the analogy.
So what is the difference between the greenhouse effect and a greenhouse? The covering on a greenhouse admits visible sunlight that warms the interior of the structure, and the covering traps the warmer air inside.
Greenhouse gases in the atmosphere do not form a physical barrier to the movement of air molecules, but trap energy by absorbing the invisible infrared radiation that you, me, your desk, your computer screen and everything else emits. We can’t normally see infrared light, but think about those “night vision” binoculars that convert this radiation to something we can see, and can allow you to track, for example, warm-blooded animals on a cold, dark night, because those creatures emit more of this “heat” radiation than the background vegetation.
You can also feel infrared radiation when you hold your hand over a warm burner on an electric stovetop, even after it has been turned off, or feel the warmth radiating from a wood stove.
Absorption of this infrared radiation is the key to the greenhouse effect and climate change.
This figure is a simplified version of the energy balance of the Earth. All the numbers are in watts per meter square, or energy per unit area (the same “watts” used to describe your light bulbs).

Let’s step through this quickly to demonstrate the importance of the greenhouse effect.
All the yellow arrows are dominated by visible light (we see as sunlight). Of the 340 units received at the top of the atmosphere, a total of 100 are reflected directly back to space by clouds and particles in the atmosphere and the surface of the planet. This total reflection of light is called albedo, and if you were on the moon, for example, this is the light you would see as the Earth. Of the remaining 240 units, 77 are absorbed and converted to heat in the atmosphere, leaving 163 reaching the surface.
The red arrows are dominated by infrared, or longwave, or “heat” radiation. Those two big red arrows between the surface and the atmosphere demonstrate the greenhouse effect. They are the biggest exchanges in the system. The red arrow up is infrared or “heat” radiation emitted at the Earth’s surface. The red arrow down represents energy absorbed in the atmosphere largely by greenhouse gases (including water vapor) that is reradiated from the atmosphere back to the surface – the greenhouse effect. The topmost red arrow is infrared radiation out into space.
If you like numbers, you can verify that all the gains and losses between space, the atmosphere and the surface sum to zero. All three parts of the system must balance.
Even before we started changing the chemistry of the atmosphere, water vapor, carbon dioxide, methane and other gases were providing significant warming. John Tyndall spoke of this effect in the 1850s. Without this natural greenhouse effect, the earth would have an average temperature around zero degrees Fahrenheit, 59 degrees colder than at present, and all water would be ice. We would not be here.
So what happens when we increase the concentration of carbon dioxide in the atmosphere? The absorbance of energy radiated up from the surface of the Earth increases and the average temperature of the atmosphere increases until emissions back to the surface and out to space balance the additional energy absorbed.
In a very real sense, this heat energy is “recycled” a few more times before being lost to space.
The standard term used for this effect is “radiative forcing” and here is one more complicated diagram with a simple message.
Carbon Dioxide Provides About 75% of the Total Net Increase in Heat Retention
Exhaustive research into greenhouse gases and other things we put into the atmosphere has been summarized in this one diagram (several similar versions can be found online). Red bars show warming effects, blue bars cooling effects.
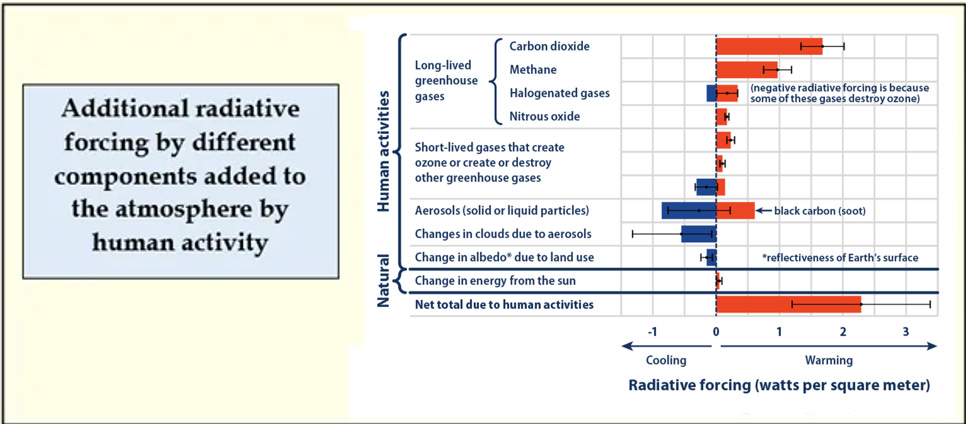
The biggest blue bars are from aerosols (like dust particles) and increased cloud cover resulting from increased aerosols, that reflect sunlight back into space (some have proposed that we increase this reflection by geoengineering the atmosphere, adding specific types of aerosols). The biggest red bar is for carbon dioxide, with other gases also contributing. Some of those same aerosol particles (“soot” in the diagram), when deposited on reflective surfaces like snow, actually increase the absorbance of solar energy (hence both a blue and a red bar for aerosols).
Getting back to the value of carbon dioxide as an index, this diagram shows that carbon dioxide is equal to about 75% of the total net change in radiative forcing due to human activity (bottom bar in the figure). More importantly, but not shown, this ratio of carbon dioxide forcing to total atmospheric forcing has remained relatively constant for decades.
It is this constant ratio between the carbon dioxide effect and the total impact of all human influences on average global temperature that supports the use of this one gas as an index of our impact on global temperatures, as captured in the first graph at the top of this essay.
One final point on the figure just above. Note that the total increase in radiative forcing is about 2.3 watts per meter square. This is added to the 340 watts per meter square received from the sun in the energy diagram above. You could ask how an increase of less than 1% in total radiative forcing could be important. Or you could conclude, as I do, that since this small increase has already increased average temperatures significantly, the global climate system is rather precariously perched at what we consider to be “normal” temperatures, and could be pushed into an increasingly “abnormal” range by small changes in radiative forcing due to continuing additions of greenhouse gases.
When Carbon Dioxide Might Lose its Predictive Power
Returning to the index concept, does the strong relationship between changes in carbon dioxide and changes in temperature mean we should concentrate only on controlling carbon dioxide? No. The value of carbon dioxide as an index depends on the fact that all of our other influences change in proportion to carbon dioxide. Reducing carbon dioxide emissions would only work as predicted by that first figure above if whatever steps we took also caused proportional reductions in all the other gases as well.
Could this index, then, lose its predictive power? Let’s explore one scenario that would break the ratio between carbon dioxide and other greenhouse gases.
In How to Avoid a Climate Disaster, Bill Gates emphasizes the need to create an all-electric economy and develop a zero-carbon electric system and grid. This may be an achievable goal. The current rush to electric vehicles and alternative sources of electric energy suggest that this change is already underway.
How would this break our carbon dioxide index?
Emissions of carbon dioxide are driven largely by combustion of fossil fuels (left pie chart below). Gates’ goal would eliminate fossil fuel combustion and carbon emissions from the industrial economy (92 percent of total emissions).
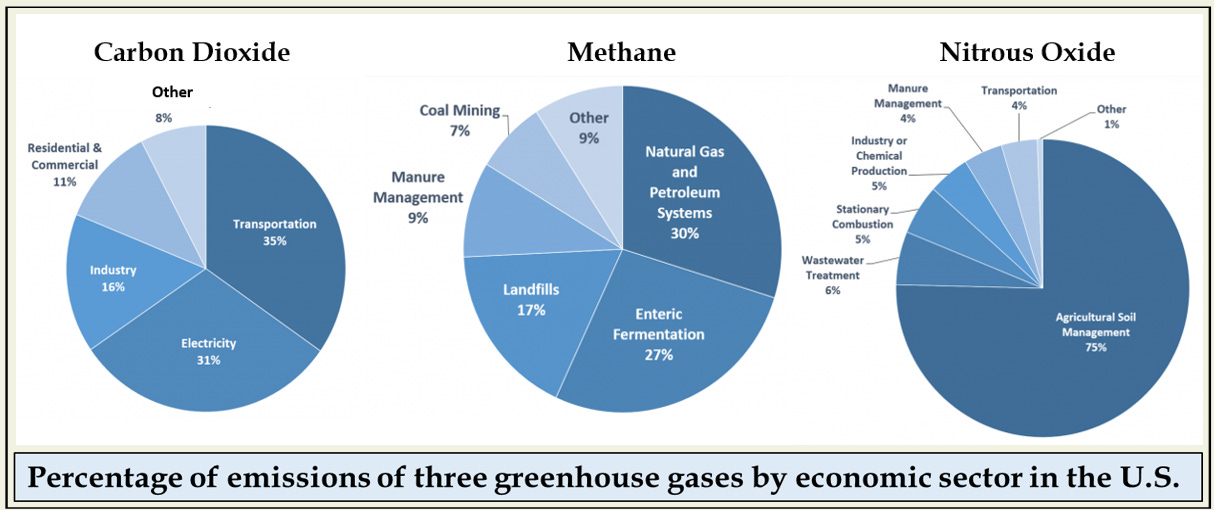
Agriculture and forestry emissions are estimated to contribute only 10.5 percent to the U.S. total (they are not even included as separate sectors in the carbon dioxide figure above), but the mix of emitted gases is very different than from industrial sources. The USDA estimates that 12.3 percent of the warming impacts from emissions of greenhouse gases by agriculture are due to carbon dioxide, 36.2 percent are due to methane, and 51.4 percent to nitrous oxide. Some of that carbon dioxide is from the production of electricity used in the food system, reducing that fraction even further if all electricity was carbon neutral.
A Zero-Carbon Economy Would Increase the Relative Importance of Agriculture
So the vision of the zero-carbon, electrified economy could leave agriculture as the main source of greenhouse gas emissions, and methane and nitrous oxide would be the dominant sources of radiative forcing.
Nitrous oxide is generated mainly from the production, distribution and application of nitrogen fertilizers (Agricultural Soil Management on the right in the figure above).
Current methane emissions in the U.S. have a large energy system component. Eliminating these sources (Coal Mining and Natural Gas and Petroleum Systems) would leave agriculture as the largest contributor. Enteric fermentation is a polite term for the digestion processes of domestic animals, especially cattle. Manure management would remain in our hypothetical, carbon neutral economic system.
For our purposes in this essay, Gates’ solution would alter the ratio between carbon dioxide emissions and total radiative forcing. The relationship between carbon dioxide and temperature change (first figure at the top of this essay) would no longer hold (that graph would get very messy).
An intriguing result of this is that in an electrified, alternate energy future, agriculture, or really the entire farm-to-plate-to-waste food system, including landfills and wastewater management, could become the major remaining source of greenhouse gas emissions. The kind of research needed to reduce these sources is very different from our current focus on carbon and energy!
Sources:
The carbon dioxide data in the top figure are from the “Keeling Curve” and are available at:
https://keelingcurve.ucsd.edu/
Global average temperature data are from NASA’s Goddard Institute for Space Studies can be found here:
https://data.giss.nasa.gov/
Numbers for the diagram of the Earth’s energy budget are from:
Many different versions of this diagram, some with slightly different numbers, can be found on the web.
The 59 degrees cooler estimate is drawn from the Wikipedia page on Greenhouse Gas
The figure on radiative forcing by different components of atmospheric change is from:
https://www.epa.gov/climate-indicators/climate-change-indicators-climate-forcing
Data on U.S. emissions of greenhouse gases can be found here:
https://www.epa.gov/ghgemissions/sources-greenhouse-gas-emissions
Data on greenhouse gas emissions for agriculture in the U.S. are here:
https://www.ers.usda.gov/topics/natural-resources-environment/climate-change/
The full reference for Bill Gates’ book is:
Gates, B. 2021. How to Avoid a Climate Disaster. Alfred A. Knopf. New York. 257pp
Wonderfully explained essay!