Why We Can't Predict Next Year's Weather
Oscillations are playing the parachute game with the climate system
An updated version of this essay can be found here
(Modified from the original blog published by Yale University Press)
What are the biggest unknowns, the biggest mysteries, the biggest sources of "noise" in our predictions of weather and climate? They might lie between the short-term weather predictions and long-term climate projections, in a seasonal-to-annual timeframe dominated by climate oscillations.
The weather forecasting community acquires terabytes of information each day to run the complex models that generate both simple icons and temperature predictions for your phone, and detailed maps of major weather features for your laptop. The science behind your daily forecast is well-known, and the value of this work in terms of saving lives and property is incalculable.
But those predictions become less accurate with each day into the future, and beyond a week or ten days out, are no better than predictions based on long-term averages. This is not due to a lack of effort or an incomplete understanding of the science, but because we can never describe the current state of the atmosphere precisely, and small errors in defining initial conditions are amplified in the models by the chaotic nature of the atmosphere.
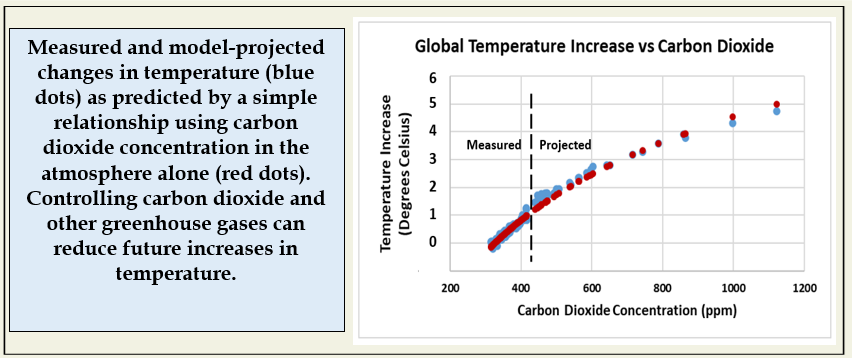
On the other hand, it is clear where the climate system is headed at the scale of decades to centuries. Increasing greenhouse gas concentrations are warming the atmosphere, and both temperature increases and sea level rise would be happening much faster if not for the inertia created by ice caps and oceans that are delaying the impact of those gasses. That inertia translates into irresistible momentum going forward, making apparent our challenging climate future. The biggest uncertainty in that future is not in our understanding of the science, but what we choose to do about greenhouse gases.
The unknowns and mysteries seem to lie between the daily weather predictions and the decadal climate projections—in a temporal space dominated by climate oscillations.
What are climate oscillations?
They are cyclical changes in the state of the oceans and atmosphere at key locations within the climate system that affect local to regional weather. Next year's weather in any one location can vary widely depending on what these oscillations are up to, and their dynamics can seriously deflect, for a year or two, long-term trends in climate.
Some of the better known oscillations may be familiar to you because of their dramatic names and equally dramatic impacts on weather extremes.
Perhaps the most familiar is the El Niño/La Niña (or ENSO) oscillation, a roughly 5-year (but highly variable) cycle of change in sea surface temperature in the equatorial Pacific Ocean. The warm phase of this cycle (an El Niño condition) has, in the past, altered the path of the jet stream over North America and brought increased rainfall to the California coast. The extent and heat content of this vast region of ocean can even cause global average temperature to be higher during a warmer El Niño event, and lower during a cooler La Niña event.
Our first mystery is this: we cannot predict accurately either the timing or the intensity of El Niño events more than a couple of months in advance.
A second mystery is revealed by last winter’s extreme rainfall and snowfall along the west coast. That happened during a La Niña event (colder than normal sea surface temperatures) when past experience would predict a drier than normal winter in California. We have clear descriptions of what happened last winter to drive that record-breaking weather, but no one predicted it, because a different oscillation played a dominant role.
The Madden-Julian Oscillation (we don’t have an accepted “nickname” for this one yet, but I think MoJO might catch on), delivered wave after wave of tropical moisture from the Indian and Pacific Oceans to the California coast in a series of atmospheric rivers. The strength of the MoJO effect might have been related to the existence of the La Niña condition. So perhaps an unusual interaction between two oscillations spelled either relief (from drought) or disaster (by floods), depending on your point of view, for California.
Unusual is a term often applied to the impacts of oscillations. They seem unusual for the very reason that we don’t know how to predict them!
Another now-famous driver of extreme winter weather is the polar vortex. The actual vortex is the normally tight cycling of the polar jet stream that contains frigid arctic air over the north pole. The vortex makes news when a rush of warmer air into the upper atmosphere over the pole weakens the vortex, allowing super-cold arctic air at the surface to escape to northern parts of North America, Europe, or Asia. When these tongues of frigid air fall onto populated regions, the polar vortex becomes big news.
Only the better news stories will note that it is a breakdown of the vortex that allows the cold air to escape, and that it is a warmer upper atmosphere over the pole that opens the gates. Cold air outbreaks in a warmer world! The strength of the vortex is often reflected in what is termed the Arctic Oscillation that captures changes in atmospheric pressure over the north pole.
These three famous oscillations are just the tip of the iceberg. How many there are, what they do, and even their names, vary across sources, suggesting that this is not settled science and that we have much to learn.
In practical terms, we cannot yet predict whether next winter in California will be a classic El Niño event with elevated rainfall (as sea surface temperatures in the central Pacific are rising), or dominated by MoJO or another oscillation. The last major El Niño event, in 2015/16, did not bring increased rainfall to California because of "unusually" warm sea surface temperatures in the far northern Pacific, a phenomenon that came to be known as "The Blob." The Blob versus El Niño made for some interesting media cartoons (see links under Sources below).
Unpredictability means that this is an area ripe for meteorological research, but it also poses a potential problem.
The accuracy of the complex, physically-defined daily weather models fades too quickly into the future to be of any use in predicting oscillations or next year’s weather. On the other hand, the momentum behind the long-term changes in the climate system we know are occurring—how average temperature, sea level rise and ice melt will proceed—does not tell us much about next year’s weather, either.
The seasonal to multi-year time frame belongs to the oscillations. At this point, increased understanding of the dynamics of oscillations seems to rely more on traditional meteorological methods, of finding patterns that can be explained by known physical relationships, than on precise first-principles modeling. We can measure with exquisite precision what is happening as it happens, we just can't predict what the future, at the scale of months to years, will bring.
And the danger in this is that the dynamic, interactive state of all these oscillations, and their impact on seasonal to annual weather extremes, might distract us from the very certain long-term trends.
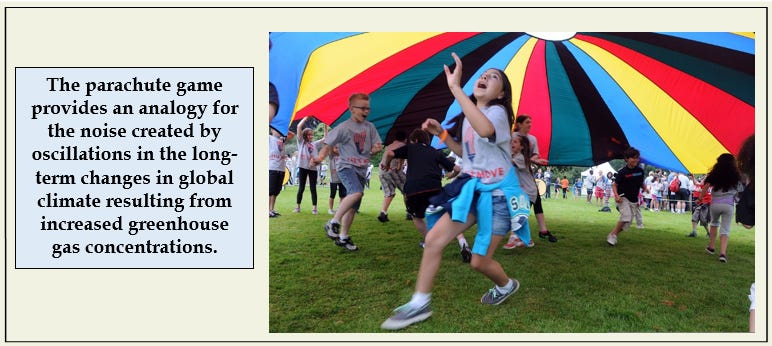
Here is an analogy that might help capture the dynamic nature of oscillations and their interactions. Schools and other organizations often use team-building games to enhance a sense of community and shared purpose. The parachute game is one example. Maybe you have watched this or played it, but if you haven’t, there are lots of good videos on the web.
A large circle of light parachute material is placed on the ground and the players are evenly spaced around the perimeter. Each person grabs the parachute at their location and then lifts and lowers their little corner of the fabric either at will or under direction. The result is an ever-changing pattern of hills and valleys that form in part by your wave crashing into waves generated by other players. Great fun.
Let’s say that the average distance between the parachute and the ground represents global average temperature, and the holders are the oscillations. Given all those constantly changing hills and valleys, how can you tell if the average distance between the ground and the fabric (global temperature) is changing? A scientist might ask: How can you distinguish the signal (change in average height) from the noise (the fluctuations). But then scientists have a way of taking the fun out of things!
If, on the other hand, all the players are on a slowly rising platform, the increasing distance to the ground will eventually become clear. In terms of climate change, we are riding a rising platform, and the long-term change in average global temperature has become measurable and significant. But any one year can vary from that long-term trend, and any one part of the parachute (or climate region) can move in a different direction from the global average.
At this point we can't predict how each oscillation will shake the climate parachute next year or how they will interact. How a warming world might affect each oscillation is another challenging question.
As we continue to learn more about oscillations, hopefully our ability to predict them will increase. In the meantime, it is important to understand that those "unusual" and extreme weather events and seasons, which grab all the news headlines, are just small deviations along the path we are clearly traveling into a warmer future with rising seas and a more energetic atmosphere.
Sources
The Yale University Press blog post is here:
https://yalebooks.yale.edu/2023/06/13/oscillations-and-wild-weather-years-cant-mask-climate-change/
An interesting book about how the daily weather forecast is produced is Andrew Blum's The Weather Machine (2019, HarperCollins Publishers, New York)
The mapped weather forecast in the first image is from:
https://graphical.weather.gov/sectors/northeast.php#tabs
The figure on changes in global temperature versus carbon dioxide is recalculated from data in:
https://eos.org/features/simpler-presentations-of-climate-change
A similar diagram is included in the Summary for Policy Makers of in the most recent report of the Intergovernmental Panel on Climate Change (IPCC) and can be found on page 28 here:
https://www.ipcc.ch/report/ar6/wg1/downloads/report/IPCC_AR6_WGI_SPM.pdf
The El Niño image and a basic description are here:
The image showing the wide range of predictions for sea surface temperatures in the equatorial Pacific is from the U.S. Weather Service Climate Prediction Center (CPC):
The CPC site presents a wealth of data on different oscillations as well as just about everything else related to weather in a data-rich and transparent way
https://www.cpc.ncep.noaa.gov/
This technical Wikipedia page discusses possible interactions between MoJO and ENSO
https://en.wikipedia.org/wiki/Madden%E2%80%93Julian_oscillation
The image of the building buried in snow is from: https://www.noaa.gov/stories/snowpack-snowmelt-water
The image of the polar vortex and background information can be found here:
https://www.climate.gov/news-features/understanding-climate/understanding-arctic-polar-vortex
This excellent source lists 9 major oscillations:
https://storymaps.arcgis.com/stories/d62f89509b504633a2c7516ab12d7767
This Wikipedia page lists 12, and many are different from the source above:
https://en.wikipedia.org/wiki/Climate_variability_and_change
Neither source discusses interactions among different oscillations
Some sample "El Niño versus the Blob" cartoons can be found here:
https://cliffmass.blogspot.com/2015/09/godzilla-el-nino-versus-blob-who-will.html
https://news.ucsc.edu/2016/07/blob-and-elnino.html
The image of the canopy game is from:


