

A Stormy Hurricane Season Ahead?
Climate oscillations and warming oceans yield predictions for an active year.

Hurricane Season and Climate Oscillations
The North Atlantic hurricane season is here and the prediction is that this year will be more active than average.

Hurricanes are the most powerful long-lived feature of the weather system. From a distance, when captured by satellite imagery and swirling safely out to sea, they can be beautiful and awe-inspiring. When they touch land or major shipping lanes, they can be devastatingly destructive.
Forecasting the path of existing hurricanes has improved markedly, but beyond the multiple-day predictions delivered by complex weather models, estimating how many storms there might be in a hurricane season moves into the realm of climatology and statistics.

And into the realm of climate oscillations.
The climate system is dominated by cycles of different lengths or return times. One of the longest is the ~100,000 year cycle of the waxing and waning of the ice ages, where massive glaciers advance and retreat from the poles towards the equator. At the other extreme are the well-known cycles of the day and the seasons.
In between, there are repeating patterns termed “Oscillations” that can take years to decades to complete a cycle, and that affect many regions of the Earth’s atmosphere and oceans. They can be measured and described, and their impacts on global weather patterns can be observed, but what causes each and how they interact is still imperfectly known.
The most familiar of these oscillations might be the El Niño/La Niña system. That will enter into this story, but let’s start by describing what drives a typical hurricane in the North Atlantic.
Life History of a North Atlantic Hurricane
If there is a typical life cycle of an Atlantic hurricane, it starts with a storm or disturbance generated by the seasonal monsoon over West Africa that moves with prevailing upper-level winds off the coast and over the tropical Atlantic Ocean just north of the equator, into what is called the Main Development Region. The warmer the water, the greater the potential for the storm to draw on that heat and moisture and gain strength. On the other hand, low-elevation trade winds out of the west can cause wind shear, stimy the budding storm, and blow it apart. A block of dry, descending air in its path can also cut off the energy supply, and the storm might dissipate.

Without these limitations, the storm can grow in size and strength (and sustained wind speed) becoming one of the most impressively organized and powerful actors that the climate system can generate.
The storm’s path might take it straight into the Caribbean and across Mexico, but most turn northward at some point, and even minor changes in that path can cause it to be either an interesting story as it moves up the North Atlantic to disintegrate over the colder northern waters, or a deadly disaster making landfall.

All storms eventually die out, either over those cold northern waters, or by loss of energy through friction between the surface wind flows and solid ground, if landfall is made.
Climate Oscillations and the Recipe for a Hurricane
So the recipe for a successful hurricane includes:
- A storm formed by the West African Monsoon that moves off the coast
- Warm sea surface temperatures in the tropical Atlantic (and the warmer the better)
- No blocking ridge of descending dry air
- No “head winds” or strong, low-elevation winds west to east across that region.
How might these relate to climate oscillations and what are they anyway?
A metaphor I’ve used before for these oscillations is the parachute game played in schools or work-related ice breakers, where a large circular swath of parachute material is held by many players and lifted and dropped at command or at random. The resulting undulations of the material capture the impact of oscillations (the players) on climate (the parachute) – unpredictable in detail, but understandable in terms of a general pattern. If this is new to you, here is a video showing the game in action – imagine the parachute surface is a map of global surface temperature, and the kids are climate oscillations!

Here are three oscillations that affect the hurricane forecast.
The Atlantic Multidecadal Oscillation (AMO) covers that Main Development Region and has an apparent cycle time of about 70 years, peak-to-peak. We have to say “apparent” because one of the challenges with understanding oscillations with longer cycle times is that we don’t have a long enough timeline of direct observations. Here is what we do have:

There are longer timelines available that hint at the 70-year cycle, but they are reconstructions based on incomplete records. Only in the satellite era have we been able to map even something as simple as sea surface temperature over large areas!
You can see that we are at the high end of a cycle. Warmer water – a stronger hurricane season.
The West African Monsoon that generates the storms that seed hurricanes, describes the annual period of summer rainfall that can vary widely year-to-year. Like the better known monsoon over India, it provides critical moisture that allows plants to grow and animals and people to be fed. The Sahel, or the fringe of seasonally dry grassland/shrubland wedged between the rainforests of the Congo basin and Saharan Desert, was much in the news in the 1970s and 1980s as extensive periods of drought led to disastrous famines.
Even less is known about oscillations in this monsoon, but what evidence there is seems to parallel the Atlantic Multidecadal Oscillation. The severe drought periods of the ‘70s and ‘80s coincided with the cooler phase of the AMO.

So the AMO and the West African monsoon might reinforce each other in driving an active hurricane season.
And then what about those head winds?
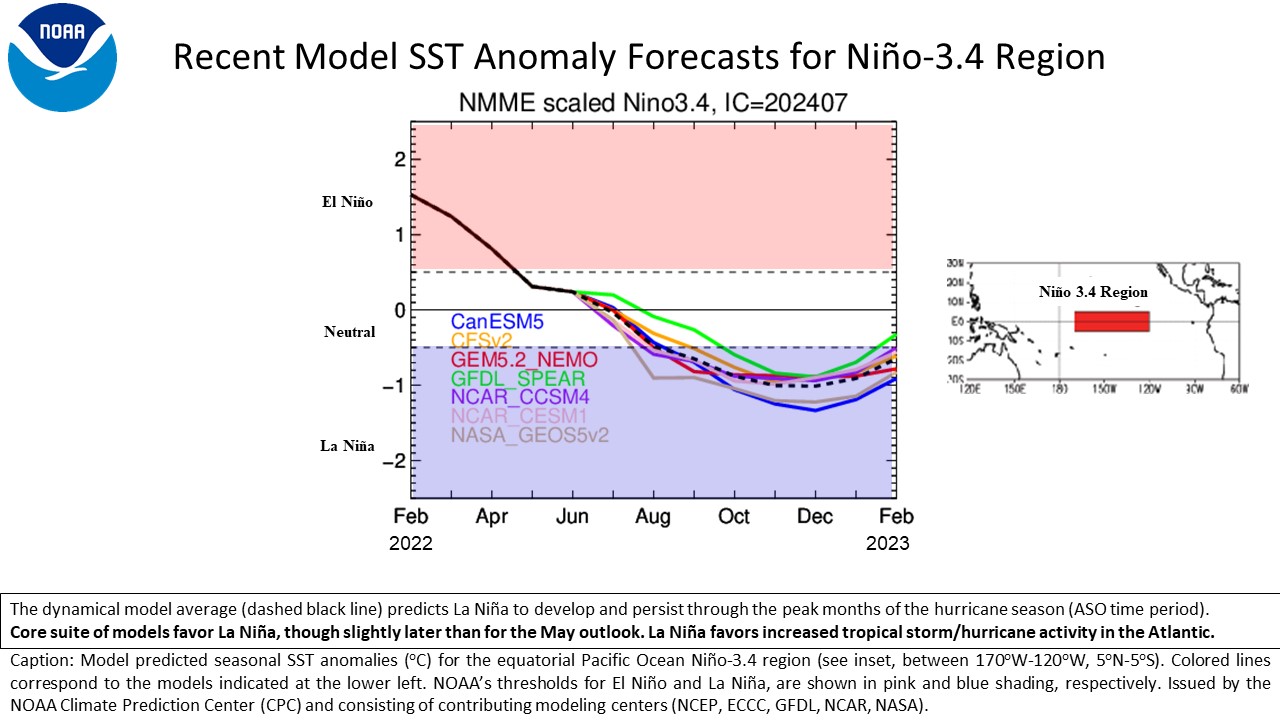
These have been linked to the state of the El Niño/La Niña (or ENSO) oscillation. The index for this is sea surface temperatures in the Tropical Pacific (see the graphic at the end of this essay). Cooler temperatures (La Niña) are linked to reduced trade winds across the tropical Atlantic and a more active Atlantic hurricane season. We are now exiting a short but intense El Niño (that was partly responsible for the extremely hot 2023 globally), and are predicted to enter another La Niña by late summer to fall.

So the 2024 hurricane season should be stronger than average because the AMO, the West African Monsoon, and the ENSO oscillations are all in stages of their cycles that are suggested to increase the intensity of the season.
And Now for Some Numbers
This all sounds reasonable enough, but are there numbers that support this story? Just how would you quantify the intensity of a hurricane season, and determine whether intensity is related to these oscillations?
The Weather Service prediction above gives us three: The number of tropical storms (sustained winds of 39 mph or higher), number of hurricanes (sustained winds of 74 mph or higher) and number of major hurricanes (sustained winds of 111 mph or higher).
We can use those, but even more useful would be an integrated number that describes the total energy embedded in all these storms over the whole season, avoiding the arbitrary distinctions of wind speed that separate the classes and including how long a storm was in a category.
There is an integrated measure available. It is called Accumulated Cyclone Energy (ACE) and is calculated as the sum of maximum sustained wind speeds above 39 MPH for all storms over the life of each storm.
An ACE index compiled since 1950 shows a general trend that mimics the sea surface temperature curve. The direct relationship between the two is stronger and covers a wider predictive range. It should be noted that an increase of only 1.5 degrees Fahrenheit (0.83 Celsius) in sea surface temperature is predicted to cause a near tripling of ACE!

ACE is also related to the ENSO index in the direction suggested, with negative numbers characterizing a La Niña condition that should generate reduced “head winds” leading in turn to higher ACE values.
There is no relationship between the AMO and ENSO indexes (they have very different cycle times) so combining the two to predict ACE improves upon either alone and accounts for 32% of the annual variation in ACE (the meaning of R2=.32).

So, yes, the numbers support the word story about the factors leading to a prediction of a more active hurricane season in 2024.
Not surprisingly, the number of tropical storms and hurricanes in a season are strongly related to Accumulated Cyclone Energy (ACE).

We Are Imposing Directional Change on these Cycles
The graph above of sea surface temperatures over time that defined the AMO suggests that a slow downturn in that oscillation’s cycle is forthcoming. But there is another forcing factor involved here as well.
Record-breaking global surface temperatures in 2023 were a big story (although we should not have been surprised). Sea surface temperatures alone were a large part of that story and also broke records in 2023 and into 2024. The coming La Niña event may bring globally-averaged sea surface temperature back to the 2023 level, but the steady increase since 1981 will not be reversed. Oceans have absorbed about 90% of the total excess heat generated by global warming. As a result, sea surface temperatures are rising and will continue to do so. A recent analysis shows that, in April, temperatures in the Main Development Region were 1.22 degrees Celsius (2.2 degrees Fahrenheit) above average and warmer than in 2023.

So, beyond the influence of cycling oscillations, this directional increase in ocean surface temperatures globally, and in the region where Atlantic hurricanes form, augers a strong hurricane season this year, and more increases for the foreseeable future. The relationship between sea surface temperature in the Main Development Region and annual ACE suggests that relatively small changes in ocean temperatures could lead to large increases in ACE, tropical storms and hurricanes.
Sources
The graphic describing NOAA’s prediction for the 2024 hurricane season is from:
https://www.noaa.gov/news-release/noaa-predicts-above-normal-2024-atlantic-hurricane-season
The photo of Hurricane Isabel taken from the International Space Station can be found here:
https://www.nasa.gov/multimedia/imagegallery/image_feature_87.html
The graphic on conditions favoring the formation of Atlantic hurricanes is from:
The images describing the paths of Atlantic hurricanes are from:
https://blog.response.restoration.noaa.gov/when-atlantic-hurricane-season
The image of the canopy game is from:
https://en.wikipedia.org/wiki/Playground_parachute
Information on the Atlantic Multidecadal Oscillation can be found here:
https://www.aoml.noaa.gov/phod/amo_faq.php#faq_2
https://en.wikipedia.org/wiki/Atlantic_multidecadal_oscillation
Sea Surface Temperatures are from:
https://www.epa.gov/climate-indicators/climate-change-indicators-tropical-cyclone-activity
The graphic of West African rainfall is from:
https://catalogue.unccd.int/1715_Drought_desertification_regreening_Sahel_Eng_Final.pdf
based on work by Descroix et al. 2012 https://www.sciencedirect.com/science/article/abs/pii/S092181811200149X?via%3Dihub
This reference links periodicity of the West African Monsoon to sea surface temperatures off the Atlantic coast:
https://www.diva-portal.org/smash/get/diva2:1752119/FULLTEXT01.pdf
ENSO index data are from:
https://origin.cpc.ncep.noaa.gov/products/analysis_monitoring/ensostuff/ONI_v5.php
Accumulated Cyclone Energy data are from:
https://psl.noaa.gov/gcos_wgsp/Timeseries/Hurricane/hurr.atl.ace.data
Numbers for tropical storms and hurricanes are from:
https://www.epa.gov/climate-indicators/climate-change-indicators-tropical-cyclone-activity
The graph of sea surface temperature since 1981 is from:
https://climatereanalyzer.org/clim/sst_daily/
And the map showing elevated sea surface temperatures in the Main Development Region and the location of the El Nino/La Nina region is from: