Block That Jet Stream - II - Impacts of a Changing Climate
Can a warmer Arctic mean more extreme and persistent weather across North America?
Spring and early summer were cool, cloudy, and drizzly here in northern New England - what the Irish would call "soft" days. Not much heavy rain in June, but 22 days with some and only 8 days with none. Not great for cookouts or trips to the beach.
And yet in southern New England and down through the mid-Atlantic states, rainfall was less than average and the U.S. Weather Service has declared a moderate drought in eastern Pennsylvania, southern New Jersey and Delaware.
I am fortunate to have a group of friends who get together regularly, and who, bless them, read these essays. The persistent damp and the most recent essay on oscillations led one to ask this question: is all this gloom the result of the state of an oscillation?
That great question, and a puzzling and recurring climate projection, that both droughts and floods will increase in a warming world, led to an exploration of the idea of persistence in weather patterns, and then to this essay.
We generally expect a parade of stormy and calm days as weather systems travel over us from west to east. An old rule of thumb in New England was to look at the weather in Oregon and expect the same here 4 days later.
But this spring it seemed the expected cycles of rain and sun had stalled, with the rainy edge locked in over New England.
Not locked perhaps, but "blocked." While I had heard this word in weather forecasts from time to time, I did not know that it had a technical definition, and only now realize that it has been lurking in the background of many of these essays. By describing blocking, we might be able to bring together several ideas that have been presented earlier and solve that conundrum about projected increases in both droughts and floods.
So what is "Blocking?"
The simplest technical definition of blocking is the degree to which the "usual" movement of weather patterns and air masses from west to east, driven in part by, or in conjunction with, the polar jet stream, is blocked by regional-scale air flow from north to south (or south to north). If you are looking at a flat map (as in this figure), the atmosphere switches from horizontal flow (called zonal) to vertical (called meridional).
One classic example is called the Omega Block because the path carved by the polar jet stream resembles the Greek letter omega (Ω). The zonal flow in the figure on the left above is replaced by the highly meridional flow on the right, forming the omega. Most of the jet stream's flow is north and south rather than east to west. Zonal flow looks pretty bland, and tends to produce bland weather, so there are fewer images of it to be found. On the other hand, an omega block can lead to dramatic outcomes.
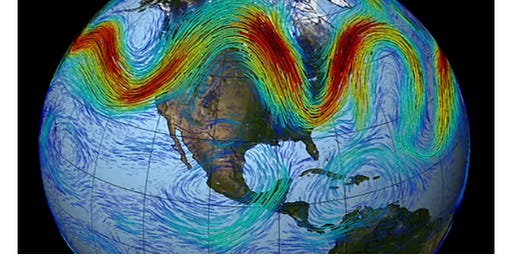
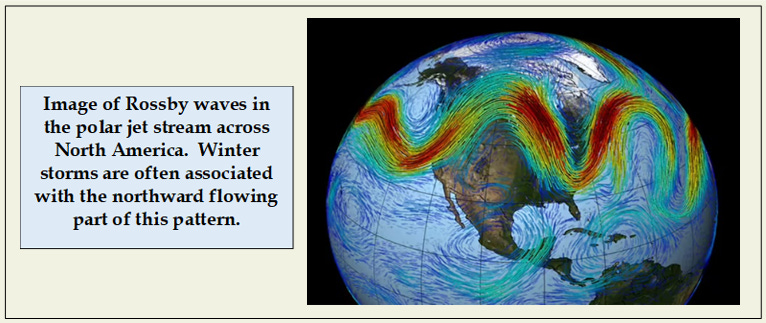
The curves in the jet stream caused by meridional flow are called Rossby waves and their depth and location, and the speed at which the air flows along these waves, has a lot to do with storm tracks and outbreaks of cold Arctic air. Rossby waves also generally travel west to east, carrying storm systems with them, but in a blocked situation, they can remain stationary for days to weeks.
In this image, much of the flow of the jet is meridional rather than zonal and the Rossby waves are clearly visible. Note that New England is under a heavy northerly flow. In the winter, this pattern can lead to strong Nor'easters - storms that draw moisture off the Atlantic and combine it with frigid air flowing down from the arctic to produce heavy snowfall. If this pattern becomes "blocked" then a tough winter is in store.
And this is just what happened for much of the winters of 2013-2015. This pattern was locked in place by what was called the "Greenland Block" and record-breaking cold and snowfall was the result.
You may recognize another important winter phenomenon linked to extreme Rossby waves. A stable polar vortex is a strong zonal flow of the polar jet around the north pole that traps frigid Arctic air in the far north and prevents outbreaks to the south. When this flow weakens, and the jet becomes more meridional, as on the right in this figure, that frigid air can move south with a vengeance, leading to record cold snaps.
Blocking is not an on-or-off thing. The U.S. Weather Service presents a graphic depiction of the relative strength of blocking using an index that is plotted over time against longitude. This index reflects gradients in air pressure from north to south (or south to north). A strong gradient at a given longitude suggests stronger air movements north to south (or south to north) as well, and a greater chance that the west to east movement of weather systems will be blocked.
New England sits at around 70 degrees west longitude, at the far left of this image, and blocking to the east of that, as in late April and late May to early June, would tend to cause persistence of whatever weather was happening. For us in New Hampshire, that was cool, cloudy, and drizzly. Not every day, but more often than average. Apparently for the mid-Atlantic, that persistent weather was dry, rather than wet. Perhaps persistence also played a role in the significant droughts in Quebec that have driven a record-breaking fire season.
So a blocked atmosphere means persistence. Whatever your weather is, it might not change while the block is in place. If it's hot and dry, a heat wave and a drought. If it's cloudy and wet, cold and floods. While the block is in place, conditions will not follow the expected pattern of alternating storms and sun.
And while blocking can be mapped in this way, it remains very difficult to predict when and where blocking will develop. And, when weather systems are stalled and move slowly if at all, daily weather becomes hard to predict as well.
As the Weather Service page on blocking puts it:
“A common finding among scientific studies is that these long-lived weather extremes are associated with recurrent atmospheric flow anomalies. Numerous studies have found that the poor forecast skill beyond a few days results principally from the inability of numerical weather prediction models to simulate the onset and evolution of blocking flows.”
So blocking
- Is hard to predict,
- Makes daily weather predictions hard as well, and
- Creates "long-lived weather extremes."
Sounds like a prescription for both droughts and floods.
So what about my friend's question about oscillations. Are they part of this story?
Oscillations are cyclical changes in conditions in parts of the climate system that affect regional weather patterns. El Niño may be the best known example. For patterns in the jet stream over Eastern North America, there are two important oscillations. The Arctic Oscillation charts changes in air pressure (high or low) over the north pole. The North Atlantic Oscillation captures the gradient in air pressure from Iceland to the Azores.
Briefly, when both indexes are positive, the jet stream tends to show zonal flow with fewer storms and cold arctic air locked in place over the pole. When they are negative, meridional flow is more likely, as is stormy weather and the occasional escape of frigid air to the south. As with other weather features, these two indexes cannot be predicted more than a week or two out, but an increase in frequency of their negative phases might also increase the chance for increased blocking and persistent weather.
According to the U.S. Weather Service, both indexes were negative for the first three weeks of June.
So in terms of "lurking in the background," you can see the connections here among atmospheric blocking, changes in the jet stream, extreme and persistent weather patterns, major climate oscillations and even the polar vortex.
And now the final question posed in every essay: What is the potential impact of a changing climate system on what has been presented? Answering this question lets us bring in another topic from a previous post - Arctic amplification.
If blocking and deep Rossby waves are associated with extreme and persistent weather, are they likely to become more or less frequent or intense as the climate warms?
This seems to be a crucial and still controversial question. Observations seem to suggest yes, while some model projections say no.
The controversy was spurred in part by a crucial paper published in 2012 that presented the idea that faster warming in the Arctic - Arctic amplification - could lead to increased persistence and extreme weather seasons to the south. How might this happen?
The strength of the polar jet is determined in part by the temperature gradient between the warmer air to the south and colder air to the north. For that reason, it tends to be less pronounced in the summer than the winter.
The arctic is warming much faster than mid-latitudes in the northern hemisphere. This would, on average, reduce the temperature gradient that drives the polar jet, making meridional flow and deeper Rossby waves, again on average, more frequent.
Impacts of this kind of shift could include a weaker polar vortex and increased episodes of extreme cold, and perhaps increased blocking and persistence in weather patterns - the "long-lived weather extremes" described by the Weather Service.
So I have an answer to my question on why we might experience an increased frequency of extreme weather events including both long-term droughts and floods in a warming world - and hopefully my friend has an answer to his question about this spring's weather as related to oscillations.
It's all about a warming Arctic, impacts on the shape, strength and persistence of the polar jet stream, and a concept whose technical definition was new to me - atmospheric "blocking."
Sources
The numbers for rainy and dry days in Manchester, NH are from:
https://www.wmur.com/article/new-hampshire-rain-june-2023/44397169#
The map of differences from average precipitation is from: https://www.nrcc.cornell.edu/regional/monthly/monthly.html
Maps of drought conditions are available here:
https://www.cpc.ncep.noaa.gov/
Definitions of zonal and meridional flow can be found here:
https://en.wikipedia.org/wiki/Zonal_and_meridional_flow
Diagrams of zonal flow and the omega block are from:
https://www.noaa.gov/jetstream/upper-air-charts/basic-wave-patterns
Other types of blocks are also described on this site.
The image of Rossby waves is from:
https://svs.gsfc.nasa.gov/3864
Nor'easters are a real thing, and are described here:
https://en.wikipedia.org/wiki/Nor'easter
The diagram of the polar vortex is from:
The image of strength of blocking by longitude and time is from:
https://www.cpc.ncep.noaa.gov/products/precip/CWlink/MJO/block.shtml
The U.S. Weather Service site that presents data on the accuracy of predictions for blocking is here:
https://www.cpc.ncep.noaa.gov/products/precip/CWlink/blocking/real_time_nh/real_time_obs2.shtml
The quote from the U.S. Weather Service on the problems of predicting blocking and its impact on predicting weather is from:
https://www.cpc.ncep.noaa.gov/products/precip/CWlink/MJO/block.shtml
Images of phases of the Arctic Oscillation and the North Atlantic Oscillation are from:
https://www1.ncdc.noaa.gov/pub/data/cmb/bams-sotc/2010/bams-sotc-2010-brochure-hi-rez.pdf
Data on the state of both oscillations can be found in graphic found here under the AO and NAO links:
https://www.cpc.ncep.noaa.gov/
The image of the formation of the jet streams is from:
https://commons.wikimedia.org/wiki/File:Jetcrosssection.svg
That 2012 paper on the theory that Arctic amplification can lead to increases in extreme and persistent weather is here:
https://agupubs.onlinelibrary.wiley.com/doi/full/10.1029/2012GL051000
And here are two media summaries of the concept:
https://news.yale.edu/2022/09/12/meandering-waves-connect-jet-streams-global-warming


