

We are Flooded with Renewable Energy Every Day
Wind and solar can be enough - Which has the greater potential?


An astounding amount of energy is available to us from sunlight and wind. Only a small fraction of the total land area of either the world or the U.S. would be required to provide all the energy we need.

The Sun Delivers 8,700 Times Global Energy Demand
Would it be surprising to hear that the Earth receives from the sun an amount of energy that is about 8,700 times total daily global demand for all types of energy?
While this is true, there are many steps between sunlight at the top of the atmosphere and electrons traveling along the grid or into your appliances or vehicle. Capturing that energy and making it available everywhere 24/7 is the challenge. Storing energy is a critical part of this story, and is the topic for next week’s essay. For this one, we’ll focus on some back-of-the-envelope calculations of just how much of the sun’s energy we might be able to capture and use.
So let’s have some fun with the numbers!
How Much Useful Energy In Sun and Wind?
Solar and wind resources are often described together as they are the two most important renewable energy sources, but there are some big differences in both the amount of energy available and the kinds of systems needed to tap and distribute them.
The top bar in this figure is that huge number for total energy received in sunlight at the top of the atmosphere (all numbers are in terawatts – TW or trillions of watts – but the relative numbers are what matter).

The atmosphere sits between the sun and our solar collectors on the ground, and absorbs or reflects ~46% of incoming radiation, leaving ~93,600 TW reaching the surface (approximate numbers are perfectly appropriate when we are having fun with these kinds of back-of-the-envelope calculations!).
We will be conservative here and say our solar farms will only be feasible on land, 29% of Earth’s surface, and that brings us down to ~27,000 TW. Let’s also say that collectors on the ice fields of Antarctica and Greenland (~10% of the land surface) are unlikely as well. That brings us to ~24,000 TW.
Solar collectors are not 100% efficient at converting sunlight to electricity. There are a number of estimates out there, and a number of competing technologies, but the numbers tend to cluster between 20 and 30%. Let’s use 25%, which then brings us all the way down to about 6,000 TW.
We have “lost” a lot of energy along the way (more than 96%!), but the bottom line is how this compares with total global energy consumption. That number would not even show up on this figure (although I have put in a small line) - It is about 20 TW. Knowing that this rough calculation gives a number for available solar energy that is 300 times global demand leaves a lot of room for economic, social and regulatory limitations!
We can follow the same steps for wind energy (numbers in the figure are drawn from a paper by Lu and others published in 2009, see Sources).
Of the 173,400 TW of power received from the sun, about 1% is converted to wind through differential heating of the atmosphere, land and water. Restricting energy capture to land and near-shore areas, as for solar, reduces this potential to 340 TW.

The actual amount of energy in wind that can be converted to electricity at any location on land is related to average wind speed, landform and even land use and vegetation type (this analysis excluded urban and forested areas). Offshore, potential sites are limited by water depth and distance from the coast. The final number in that 2009 paper for global potential energy gain is 96 TW, or about 4.8 times global energy demand.
The rough calculations in these two figures suggest that there is more than enough renewable energy available to power the global economy, although the potential for solar appears far greater than for wind (from the figures, 300 times global demand for solar versus 4.8 for wind).
How Much Land Area Would Be Needed?
Here is another set of fun calculations.
Solar collectors can take up a lot of space, so since we are talking fun-with-numbers here, let’s use the U.S. as an example and sketch how much land would be needed to capture enough energy to meet national needs. Keep in mind here that we are talking not just about electricity, but all energy gained from oil, coal, gas, nuclear and renewables.
Through the maze of energy conversion tables listed under Sources (why do different organizations use so many different units?), US energy demand appears to be ~2.54 TW (or ~13% of total global energy usage). We’ll be conservative again and limit the construction of solar farms to the contiguous 48 states, which together represent ~5% of the land area of the Earth. Five percent of 6000 TW (first figure) gives us about 300 TW to play with. So acquiring 2.54 TW for all U.S. energy needs would require (back-of-the envelope) about (2.54/300), or less than 1% (actually about 0.85%) of the total land area of those 48 states. That would be about one acre out of every 118.
And how does that “less than 1%” relate to current land uses in the U.S.?
There are estimates of the total coverage and potential energy capture of rooftops and parking lots across the country. Those numbers (far right column below) are less than total energy demand, but could provide 37% of that total, or about twice the current total consumption of electricity alone. An advantage of a distributed source like rooftops is that the energy can be used first where it is produced, reducing the need for increased capacity on the national grid system. A later essay in this set will highlight this and other “behind the meter” solutions.
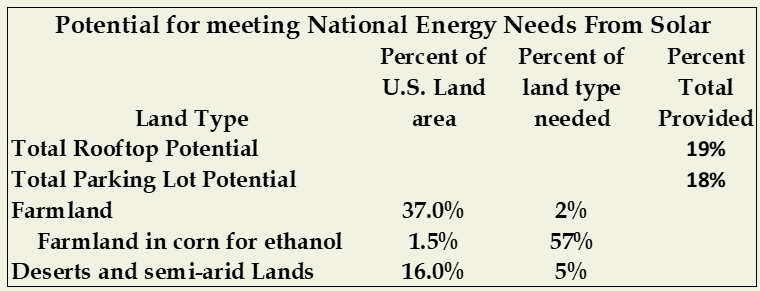
For non-urban areas, either ~2% of all farmland or ~5% of all desert and semi-arid lands could meet all U.S. energy needs.
Converting Corn for Ethanol Farms to Solar Farms
Farmland planted in corn for ethanol is a particularly intriguing number. By federal law and rules, 10% of gas at the pump has to be ethanol. The conversion to all-electric vehicles looks like it might become the fastest part of the transition toward an all-electric, low-carbon economy. As we reduce the number of gasoline-powered cars, we reduce the need for ethanol. Converting just over one-half of the current corn-for-ethanol farmland to solar farms could meet national energy needs.
Why Hasn’t It Happened?
OK - so if the capacity is there, why haven’t we all gone totally solar? There are lots of economic, policy and regulatory roadblocks, but most of those are not topics for this Substack site – we just deal here with science and technology.
There is one technical/regulatory roadblock that was addressed in an earlier essay - “Gridlock” or limitations on the rate at which renewable energy sources can be added, in the U.S., to the national grid system.
But the primary technical limitation to high dependence on solar power is that it is not always available – no energy at night or on cloudy days. The quick answer to that problem is energy storage, and there are a number of proposals for that. Batteries come to mind, but we will also look at other innovative solutions in the next essay.
We are starting to get too serious here. The fun part of this fun-with-the-sun, back-of-the envelope approach is envisioning what might be, with just a first, rough set of calculations to see if we are totally off-base. So far we seem to be hitting home runs.
Electric Vehicles as a Way to Store Solar Energy
And in this vein, here is a mental romp on a distributed (decentralized) system that combines solar energy and electric cars and battery storage and your daily home and transportation needs (and thanks to my colleague Cameron Wake for introducing me to this system-level energy solution).
E-cars (total electric cars) and plug-in hybrids, seem to be the wave of the future. Major automakers are advancing this transition from gasoline at warp speed. Increasingly, there is talk of the feasibility of battery systems in E-cars that can provide as well as accept electrons. This becomes the key link in this fun-with-the-sun scenario.
If your E-car can be recharged during the day at home or at work or at other destinations from renewable sources, and you don’t need the full capacity for daily driving, then your car batteries become your local storage to power your home at night. Reliance on the grid and large utilities could be greatly reduced.
Sounds good, but we need some numbers to play with. Some E-car sites give estimates of storage capacity of up to 200 kilowatt-hours. Average daily home electricity usage is about 30 kilowatt-hours. Excess storage capacity would mean that you would not have to fully recharge the car each day. Those 200 kWh car systems have a predicted driving range of over 300 miles on a single charge, so your daily driving needs might not make a big dent in stored energy.
Here is a final, fun, back-of-the envelope calculation. There are about 250 million cars and light-duty trucks (like pickups and vans) on the road in the U.S. If these were all electric and could store 200 kilowatt hours of electricity each, the total storage capacity would be about 50 million kilowatt-hours. Daily electricity consumption in the U.S. is about 10 million kilowatt-hours. If we could even partially recharge all those vehicles each day, keeping the lights on at night might not be a huge problem.
Could this work? As one example, the University of Massachusetts Amherst campus is installing solar canopies over some parking lots linked to a battery storage system. This is just one of several community- or building-level approaches to what are called “behind the meter” solutions. We will look at some others in a later essay in this set.

I realize that this solar panel/car/home energy system will not be feasible for the 3% of the U.S. land area that is densely urban (and the 60% of the population that lives there), or for those who do not have cars. This is really just one idea that might help make a dent in our dependence on carbon-based fuels. We will need several others, but it seems that the energy resource (the sun) might not be the factor limiting our journey to the all-electric future. Creative solutions needed!
Our Fun Numbers Point to a Solar-Electric Future
So, I have had fun playing with the numbers and seeing what we might learn from our back-of-the-envelope approximations. They all seem to tell us that there is a huge untapped potential to use the sun to power our future.
Sources
This NASA site is the source for the amount of solar energy received from the sun and the amount absorbed by the atmopshere:
https://earthobservatory.nasa.gov/features/EnergyBalance
The 2009 article on wind energy potential is: Lu, X., M. B. McElroy and J. Kiviluoma. 2009. Global potential for wind-generated electricity. Proc. National Acad. Sci. 106:10933-10938. doi.org/10.1073/pnas. 0904101106
https://www.pnas.org/doi/10.1073/pnas.0904101106
And these offer a wide range of spacing requirements for turbines:
https://www.landmarkdividend.com/wind-turbine-lease-rates-2/
https://sciencing.com/much-land-needed-wind-turbines-12304634.html
https://en.wikipedia.org/wiki/Wind_power_in_the_United_States
Calculations for rooftop solar potential are from:
https://www.osti.gov/pages/servlets/purl/1462462
https://arstechnica.com/science/2018/02/a-solar-panel-on-every-roof-in-the-us-here-are-the-numbers/
A source for efficiencies of solar collectors is here:
https://www.nrel.gov/pv/device-performance.html
The 20 TW estimate is derived and recalculated from:
https://ourworldindata.org/energy-production-consumption
which in turn is drawn from
Data on areal extent of surface parking lots is from:
https://www.strongtowns.org/journal/2019/11/27/parking-dominates-our-cities-but-do-we-really-see-it
https://www.census.gov/library/stories/2017/08/rural-america.html
Data on building rooftop area and potential solar energy capture is from:
https://www.nrel.gov/docs/fy16osti/65298.pdf
https://electrek.co/2021/10/18/egeb-rooftop-solar-could-match-annual-total-us-power-generation/
Data on farm acreage and fraction of corn production going to ethanol are from:
https://www.nass.usda.gov/Publications/Todays_Reports/reports/fnlo0220.pdf
http://ethanolproducer.com/articles/11926/usda-releases-10-year-projections
https://www.nass.usda.gov/Publications/Todays_Reports/reports/acrg0621.pdf
Data on desert and shrubland area can be found in many places (with different definitions and estimates of areal extent). Here is one:
https://www.worldatlas.com/articles/the-major-deserts-of-the-united-states.html
A story on the University of Massachusetts solar parking canopies here:
https://www.umass.edu/sustainability/climate-change-energy/solar
Data on number of cars and light trucks is here:
https://www.fhwa.dot.gov/policyinformation/statistics/2019/vm1.cfm
Data on average home electricity usage is from:
https://www.eia.gov/tools/faqs/faq.php?id=97&t=3
and total daily U.S. consumption is from:
https://www.eia.gov/energexplained/electricity/use-of-electricity.php