

Why Was 2023 So Much Warmer Than Any Other Year?
Global Warming and a Strong El Niño Deliver a One-Two Punch

It’s a dark and stormy - well - Sunday morning. As I write this, the first measurable snowfall of the winter here in southern New Hampshire is accumulating outside, and what better way to spend a cold and snowy morning than with a cup of coffee and a spreadsheet filled with intriguing numbers!
And how ironic on a cold and snowy day to ask those numbers if they can tell us why 2023 was not just the warmest year on record, but warmest by a large margin?
I enjoy exploring the stories hidden in numbers, especially those related to weather and climate. And I guess I am not alone, as by far the most frequently accessed post on this Substack site has been a simple spreadsheet-based approach to examining the connection between carbon dioxide and global temperature. So let’s try the same approach with this one.
The term “quantitative reasoning” is in the title of that popular post. This just means that you start by looking for patterns and relationships in a set of numbers that would be expected based on the science (simple charts and graphs are a good way to approach this) and if you find something, you can use simple statistics to see if those patterns are real.

Here is another example: some simple arithmetic that shows how we could meet global energy demand using solar power alone. The same approach was used in the very first essay on this site, Climate Change in Four Easy Steps.
One of the best long-term climate records we have is for sea surface temperatures in the central Pacific Ocean that define the state of the El Niño/La Niña or ENSO (El Niño/Southern Oscillation) system. This is the most familiar of several interacting oscillations in the climate system that make it so hard to predict next year’s weather.
So let’s use this data set to explore quantitative reasoning and the role of La Niña/El Niño in contributing to changes in global temperatures – as the snow continues to fall.
The term El Niño reappears in weather news stories every 5 years or so (and we will see why in a minute), especially when it can be related to emerging weather extremes.
We are in a very extreme period right now. The combination of general global warming with a strong developing El Niño event may well be causing the spike in global temperatures recorded last year and may drive extreme weather events on the west coast of the U.S. and elsewhere in the world this winter.

The U.S. Weather Service declares an El Niño event whenever the sea surface temperature in the center of the equatorial Pacific is more than 0.5 degrees Celsius above the long-term average (see the map in the box above) for three months in a row. A La Niña event is declared when that value is more than 0.5 degrees below the average for three months. That 0.5 number is an arbitrary boundary that we will ignore a little later on.
Historically, this mid-Pacific sea surface temperature has deviated from the average by as much as -2 degrees Celsius (strong La Niña) to +2.5 (strong El Niño). That first quantitative reasoning post showed that global temperatures are so closely related to the concentration of carbon dioxide in the atmosphere that a secondary relationship with this ENSO index could be identified as well.

Essentially, a shift from the highest to lowest values for this ENSO index can shift global average temperatures by as much as a quarter of a degree Celsius, or almost 25% of the ~1 degree increase measured so far. This tropical marine region is so vast and contains so much heat that even a small variation in surface temperature can alter weather patterns worldwide.
El Niño events drive warmer global average temperatures while La Niña means a cooler atmosphere.
El Niño events are also statistically related to increased winter rainfall across the southern tier of the U.S. and can include some major storms along the west coast. Mild winters with little snow can be expected across the northern tier. This year’s winter forecast from the U.S. Weather Service predicts a classic El Niño pattern.

But the winter of 2022/23, with record-breaking rainfall and snow accumulations in California during a La Niña episode, showed that ENSO interacts with other oscillations in the climate system, so outcomes in any one place are hard to predict.
Data on the state of the ENSO system are available from the U.S. Weather Service going back to 1950. Here is part of that record.
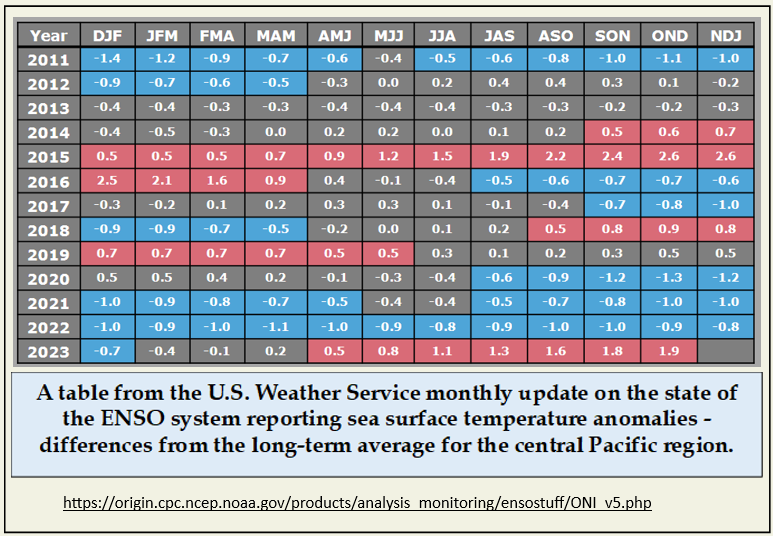
Because the region covered by the ENSO system is so vast, sea surface temperatures change slowly, so the data are compiled and reported using a three-month running average. The cryptic “DJF..JFM” etc. represent the 3 months of measurements averaged to produce that month’s number (e.g. DJF is December, January and February averaged and reported in the January time slot).
Numbers are expressed as anomalies, or differences from the long-term average. The color of each box represents either an El Niño (red) or La Niña (blue) event.
August 2020 to January 2023 was one of the longest La Niña-dominated episodes in the record, and coincided with a pause in the continuing increase in global average temperature. Time periods dominated by La Niña events over the last 73 years (top figure below) have often coincided with periods of low or no increase in globally averaged temperature.
We have now moved from that long La Niña episode into what looks to be a strong El Niño event beginning last May. The warming central Pacific has been linked by many to the highest-ever global temperatures that occurred in the second half of 2023 (bottom figure below).

Now for those questions that kept me out of the storm on Sunday: Is the emerging strong El Niño, and the warmer global temperatures it appears to be causing, a blip or part of a normal cycle or a new trend? Are the recurring cycles in sea surface temperature becoming more extreme? Should we expect ENSO to drive our weather and climate future? Can we predict the future of the ENSO index captured in that table above?
Heady questions for a morning at the computer watching the snow fall.
We can start by looking at the basic data (ENSO Index is the same as deviation in mid-Pacific sea surface temperature from the long-term average):
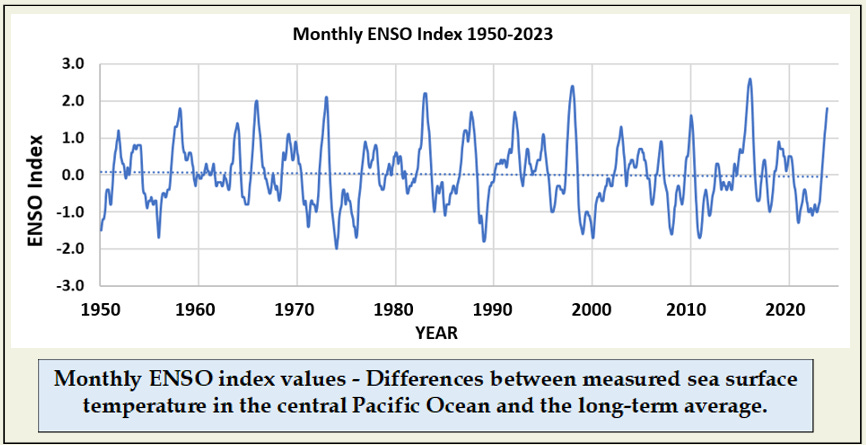
Positive values are warmer than average, and the Weather Service would call anything above 0.5 for three consecutive months an El Niño event. Negative values are cooler, and more negative than -0.5 for three months is a La Niña event.
You can see the cyclic nature of this system. The long-term average of all of these numbers is essentially zero (not surprisingly) but also there is no indication of a trend. There are slightly more negative values (440) than positive ones (408) but no trend there either.
Does this month’s number tell you anything about future values? Well, yes and no. With overlapping 3-month windows for these average differences, the best predictor of next month’s value is the one for this month.

That R2 number in the graph on the left (.94) can be translated into English as the fraction of the variation in next month’s temperature that is explained by this month’s value. 94% is a very high number – we can explain all but 6% or the variation next month using this month’s number alone.
Unfortunately, this nice relationship falls apart as you try to predict further into the future. You can see what this looks like for predictions 12 months ahead in the graph on the right. There is no statistical significance in an R2 value of 0.007 (predicting less than 1% of the actual variation). So this month’s value tells us nothing about what that value will be a year from now. Existing computer models don’t do a whole lot better than this.
But here is one of those quirks that makes the detective work fun. Beyond 12 months the relationship gets stronger again. The r value used here is called the correlation coefficient. It also captures the degree of agreement between two sets of numbers, but can range between +1 and -1.

At 12 months out, this value is near zero, repeating what was said above about no predictive power. The numbers become significant again from 13 to 30 months, BUT they are negative – what is that about? This says that two years out from any measurement, the state of the system is likely to be the opposite of what it is now. So if you are in positive territory this year, you are more likely to be in negative territory 24 months from now, and vice versa - a classic depiction of a cyclical event.
Is there any indication of change in the distribution of all the values in the table? Are there more “warm” months now than in the past?
One way to look at that is to summarize the number of months within certain ranges of values. This table shows no differences between the full record from 1950 and a shorter record from 1980, so more recent distributions are not different from older ones, reinforcing the lack of a trend in that first chart of the full data set.

What else can we extract from this data set? (The snow is about 4 inches deep now).
Here are some interesting questions: How frequent are La Niña and El Niño events and how long do they last? Are they becoming more frequent, lasting longer or increasing in intensity?
Here is where we break with the Weather Service. There are so many months that go back and forth across the 0.5 boundary that separating them into discrete events gets clumsy. So, I am going to use a 1.0 limit.
With that limit, there are 15 events where the index is greater than +1 for three or more consecutive months (El Niños) and 13 that are more negative than -1 (La Niñas).
Average values for duration and “return time” (years between events – calculated as total number of events divided by total time – 15/73 for El Niño) are similar for both La Niña and El Niño, but individual events vary widely in both timing and intensity. There is no trend in any of these numbers across the 73 year record. Some classic time series analyses failed to produce any additional insights.
The average return time for an El Niño event is about 5 years, which answers that question about why El Niño is in the headlines only every 5 years or so!

So what have I learned on this snowy morning spent doing some quantitative reasoning with intriguing numbers? What can we say about the ENSO system and the La Niña and El Niño events that happen there?
Here (in the blue box) is how I would summarize the results. Now it’s time to go shovel some snow.
