

Flooding of Coastal Cities Will Increase Exponentially
How a slow but steady linear increase in sea level becomes a non-linear increase in high tide flood frequency

What Drives Sea Level Rise
Sea level rise may be our biggest climate challenge in the long run.
The oceans of the world have delayed warming of the atmosphere by absorbing both carbon dioxide and excess heat. That excess heat is reflected in increasing ocean temperatures which lead in turn to thermal expansion (liquids increase in volume as they warm) that contributes to sea level rise.
And while melting of the Greenland and Antarctic ice caps is on-going, they are not in equilibrium with current temperatures, assuring that melting will continue even if we halt the increase in global temperature.
So while both oceans and ice are delaying the full impact of greenhouse gas emissions on the climate system in the short term, they are still driving a continuous increase in sea level.

The downside to these delayed responses in the climate system provided by ice and oceans is that they translate into long-term momentum. The oceans will continue to warm and expand, and will be fed by melting ice, even if we achieve major reductions in emissions.
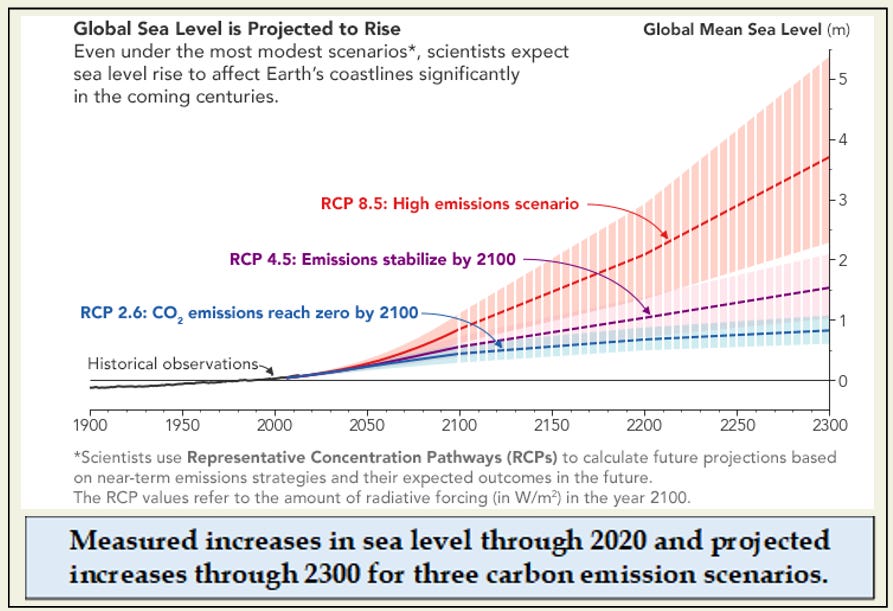
The figure below captures this momentum. If we achieve zero carbon emissions by 2100, sea level will continue to rise by almost 3 additional feet through 2300. Capping emissions at current levels would drive a rise of as much as 5 feet, while a continuing increase in emissions could mean an increase of 10 feet or more.
There are no scenarios that project reduced sea levels, but these slow, steady rates of increase are out of sync with the 24-hour news cycle. Compared with the intense and tragic stories of individual events – hurricanes, tornadoes, heat waves, floods, and fires – sea level rise seems ploddingly slow, even though all the ocean-based storm and tide events will build on this irresistible upward expansion of the oceans.
And while increases in sea level have been minimal so far, and appear relatively minor through 2050 or even 2100 in the figure above, flooding events are already becoming more frequent in many places. So here are two questions:
Can a small increase in sea level translate to significant increases in the frequency of non-storm, high-tide flooding events in coastal cities?
Is there something about the distribution of non-storm high tide frequencies that might explain this increase?
The answer to both of these questions is yes, and we will get to why in a minute, but let’s start with a look at the available data on recent increases in flood frequencies and projections for the future.
Coastal Flooding in the Future
Impacts of higher high tides can be presented either visually or with numbers. One website that I cannot relocate, and has apparently been taken down, offered visual images of some iconic locations around the U.S. under different scenarios. For example, these two are for Fulton Street in New York City. The left image is for current high tide conditions, the right for a non-storm high tide following a 4 foot increase in sea level.

For a data-rich look at the future, a NOAA site offers numbers on non-storm high tide flood events for 2000, 2010 and 2020, as well as projections through 2050 for 5 different emission scenarios.
The results are startling.

The first thing to notice is that all the projections show exponential or non-linear increases in flood frequency. These six cities are just a small sample of the more than 100 locations for which flood history and projections are available.
The range in flooding response among cities to sea level rise is due to a number of factors relating mostly to local topography, tidal range, and whether the landform under the city is sinking (subsiding) or rising.
Most cities in the full data set rarely or never experienced non-storm, high tide flooding prior to 2010. Increases from 2010 to 2020 are not zero, but are mostly small. In vivid contrast is the dramatic increase for all cities projected into the future. Galveston stands out as a worst-case scenario, with flooding increasing from just a few to over 100 events per year under the low emission scenario and to 250 per year (nearly 70% of days would experience flooding) under the high emission scenario, even in the absence of storms.
From Linear Sea Level Rise to Exponential Flooding Frequency
Increases in sea level through 2050 are relatively small and essentially linear (not accelerating over time). How can that linear increase yield the exponential increases in flooding events projected through 2050 seen in the figure above?
Measured, non-storm high tide levels will vary with season, phases of the moon and other factors, but there is generally a distribution of the frequency of actual height of high tides that looks like this:

The actual high tides recorded in the twice daily cycle could be (using this fictitious but representative data set) anywhere from 3 feet lower than average to 3 feet higher. The cumulative frequency, or the fraction of tides that are above a certain level, is shown here:

Both figures show that extreme high tides (approaching 3 feet above average) are exceedingly rare in the absence of sea level rise. Let’s say that local flooding in this hypothetical city occurs whenever a high tide exceeds 2.7 feet above the average. On this figure, that would happen on ~2% of tidal cycles. If sea level increases by 1 foot, then any high tide more than 1.7 feet above average, building on this higher base, will cause flooding. This will happen 15% of the time. With a 2 foot rise, any tide more than 0.7 feet above average will lead to flooding, and that will happen on 50% of tidal cycles.
The shape of these frequency curves underlie the projected exponential increase in flooding events even with moderate and linear increases in sea level.
Are Coastal Cities Preparing for Increased Flooding?
Two essays posted two years ago reviewed steps being taken in the U.S. and in four European cities to prepare for the inevitable rise in sea level.
In the U.S., planning in 7 cities and regions from New England down to Miami and across to Houston varied widely. Planning organizations in all locations were aware of the threat and were formed to address it. Two areas, Norfolk, VA and Charleston, SC, had participated in what is called “The Dutch Dialogues,” a focused process of discussion and planning that originated in Holland. Both cities generated plans for seawalls, soft engineering of shorelines, tidal gates and other approaches, with total costs in the billions of dollars.
Charleston is undertaking a unique approach, proposing to raise houses in the flood-prone historic district by 6 feet at a cost of about $100,000 per structure.
Boston and New York have designed resilience projects involving raising infrastructure, building seawalls, enhancing short-term stormwater storage, and even removing buildings from flood-prone areas. Again, costs are in the billions of dollars. Boston has committed 10% of annual capital spending to the resilience plan. There was a $36 billion plan for tidal flood gates for the entrances to New York’s harbor, but that was deemed too expensive to pursue.
Houston has a $29 billion plan that involves seawalls, levees and storm surge gates, but recent posts suggest that only minor efforts at neighborhood resilience planning are the focus now. One post says:
Resilience community planning seeks to build the capacity of a community to prepare for, withstand, and recover from shocks and stresses. The goal of Houston’s Neighborhood Resilience Planning (NRP) is to create a community that can adapt and thrive in the face of a range of potential challenges, such as natural disasters, economic challenges, or to improve social empowerment strategies.
Miami relies on federal money to replenish eroding beaches and has only a few plans to increase resilience.
New Orleans has a long and complex history of attempts to deal with flooding, but one NOAA site suggests that most of the delta area and the city itself will be under water frequently with a 3 foot rise in sea level.
Four European cities have taken the plunge and spent billions on flood gates to resist storm surge of several feet. Not surprisingly, Venice and two Dutch cities, Amsterdam and Rotterdam, are on that list. The surprising one is St. Petersburg, Russia, which has flooded almost annually for much of its history. Those gates are in place in these four locations, and appear to be effective.
While these projects also ran into the multiple billions of dollars, the damage avoided is predicted to more than repay the cost.
We Can’t Say We Didn’t Know
Buried in the kinds of technical reports, scientific analyses and agency summaries presented here are startingly dangerous projections for what sea level will do and mean for coastal cities by 2050 and 2100. Many in the rising generations (Millenials, Gen Z, Gen A) can expect to experience major disruptions as sea levels increase. Those disruptions can be minimized, but not totally avoided, by changing the arc of global warming through reductions in the net emissions of greenhouse gases.
Sources
The figure describing increasing sea level due to ice melt and thermal expansion is from:
https://www.climate.gov/news-features/understanding-climate/climate-change-global-sea-level
The figure of past and projected sea level rise through 2300 is from
https://earthobservatory.nasa.gov/images/148494/anticipating-future-sea-levels
NOAA’s definition of high tide flooding is here:
https://oceanservice.noaa.gov/facts/high-tide-flooding.html
And the descriptions of the flooding scenarios are here:
https://oceanservice.noaa.gov/hazards/sealevelrise/sealevelrise-tech-report-sections.html
Graphs of change in flooding frequency for the five sea level rise scenarios were constructed using data from:
https://tidesandcurrents.noaa.gov/high-tide-flooding/annual-outlook.html