

"It Was a 1,000-Year Storm!"
Predicting the chances of extreme weather events - Including ones that have never happened!

A "1,000-year event." A "500-year event." While we might brush these phrases off as media hype, they can have an important meaning. How often should we expect extreme weather events to happen? The answer might help planners decide how much effort should go into preparing for the next big one.
Two of the biggest weather stories this year were the prolonged and extreme winter season in California and last month's brief, intense rainfall event in the Hudson River Valley. How extreme were they? When might we expect a repeat performance?
The most recent essay here started with a friend's question about persistence and oscillations. This one has been inspired by a straightforward question from the same source: How can we even call something a 500-year event with less than 500 years of measurements?
So we are dealing with numbers here, and to my surprise, the posting on this Substack site that has registered the most visits is the numbers-focused one on "Quantitative Reasoning." That post used a simple spreadsheet example to relate carbon dioxide to global temperature.
So let's build on my friend's question and what seems to be something of a thirst for numbers, and take another dive into some basic weather data. Maybe we can find a real 1,000-year event!
Estimating the probability of rare events can be a challenge, just because they are so rare, but if you have the data, the arithmetic involved is simple. You can repeat the analyses reported here using a spreadsheet if you like, but a calculator, pencil, and graph paper will do just as well. Links to the data used here are listed under Sources below.
Florida Hurricanes
An earlier essay on Hurricane Ian presented return times for hurricanes in Florida based on records going back to 1851. Counting the number by category gives the "Number of Storms" column below. The "Cumulative Number" column shows the number at that level or higher for the full list of 38 storms.
The "Chance per Year" column is a percentage found by dividing the Cumulative Number by the number of years in the record. The "Return Time" is the inverse - divide the number of years by the Cumulative Number. By this metric, a hurricane of category 4 (like Ian) or higher has made landfall in Florida once every 10.7 years.

Have strong hurricanes become more frequent? One way to look at this is to do the same calculation for a shorter time period. The second box and blue line above show the results using data only from 1944 on. The lower line means a shorter return time for each category.
It is hard to draw a continuous relationship with only three categories. More is better. The same data source also includes the maximum sustained wind speed at land fall for each storm in 5 MPH increments. By this metric, Ian was second only to a storm that struck on labor day in 1935. These two events give a return time of 86 years (172/2) for storms with winds topping 150 MPH at landfall.
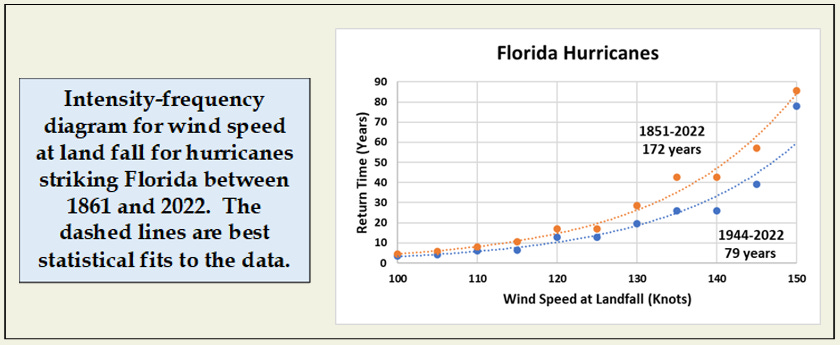
Limiting the numbers again to storms since 1944, Ian is the only storm at 150 MPH or above, giving a return time of 79 years. This figure would suggest that the return time for storms with, for example, 130 MPH winds at landfall might have decreased from about 28 years to about 20 years.
The longest return times are exceedingly dependent on rare events! If this analysis stopped in 2021, before Ian, there would be only one storm above 150 MPH, and a return time of 172 years!
While this method cannot be used to extrapolate beyond the range of actual measurements, there is another approach presented below for the Hudson Valley storm that can.
So Ian was certainly not a 500-year event. It was somewhere between a 10.7-year (category 4) and an 86-year (150 MPH wind speed at landfall) event. Anecdotally, Ian followed nearly the same path as Hurricane Charley, also a category 4 storm, that struck in 2004. Two major storms in the same area in 18 years.
California Floods and Droughts
The biggest weather story of 2022-23 was the continuous series of intense, atmospheric river-driven storms that brought "record-breaking" rain and snow to California. Again, just how unusual was this winter? How long might it be before it happens again?
An earlier essay presented the history of a similar winter in 1861/62 that also served as context for a U.S. Geological Survey study envisioning an "ARKStorm" or worst case scenario for flooding across the state (billed as a 1,000-year event!). Both that essay and the U.S.G.S. report were rather timely, considering what happened in 2022/23!
Precipitation can vary widely over short distances and time spans, as we will see in the Hudson River example as well, so somewhat different conclusions can be reached using different locations and time frames. I can only present a few examples here. You can use the data links under Sources to try other sites.
The "water year" in California hydrology runs from October 1 to September 30. This is to capture the wettest months, December through April, in a single season (as opposed to putting December and January of any one winter in different years). On average, 87% of annual rainfall in Los Angeles occurs in the December-April period. For San Francisco, that number is 78%.
Data for the water years of 1931-2023 for those two cities show very similar intensity-frequency relationships for December-to-April rainfall. Average precipitation for San Francisco in this time period is 16.7 inches. For Los Angeles the average is 14.2 inches.

And the winter of 2022-23? Total December-April rainfall was 25.5 inches in Los Angeles and 28.8 in San Francisco - both about 70-80% above average and with a 10-12 year return time.
Snowfall totals also show very wide differences at different locations. The California Data Exchange Center records daily snow water equivalent for a large number of sites in the Sierra Nevada Mountains. I picked two sites. Parks Creek is in the far northern part of the state, near Mt. Shasta (elevation 6700'). Rock Creek, is in the southern Sierras near Owens Valley (elevation 9050'). Again, you can repeat this analysis for other sites using the link under Sources.
Snow tends to accumulate throughout the winter in these high mountains. April 1 is treated as the end of the accumulation period and snow water equivalent content on that day is an indicator of the intensity of the snow season. Water equivalent is the amount of water you would have if you melted all the snow on the ground on a site, and is a better indicator of water yield and flooding potential than snow depth, as the density of snow can vary widely.

The two sites have very different average snow accumulation numbers. Rock Creek averages 10.7 inches of snow water equivalent on April 1, and Parks Creek averages 33.1 inches. The frequency-intensity relationships differ widely between the two sites. The return time for a 40 inch accumulation vary from about 5 years for Parks Creek to about 40 years for Rock Creek.
And the winter of 2022-23? The Rock Creek number is 33 inches, or about 3 times the average, with a return time of just above 20 years. The Parks Creek number is 45 inches, less than 50% above average, with a return time of about 10 years.
As the snow melted, major areas of flooding were reported. Some of those reports focused on lakes that had disappeared during massive droughts over the previous decade and had suddenly reappeared. Those lakebeds had been farmed in the dry years, and that land, when re-flooded, was then "lost" to production. In addition, the extensive system of reservoirs, that were very low in 2021, had been refilled by rainfall before April 1, 2023, and had no capacity to delay flooding.
Still, flooding in the Central Valley of California, beyond the dry lakebeds, was less than mapped for the winter of 1861/62 or predicted by the ARKStorm analysis, so maybe 2022/23 signals a return to a more normal pattern of repeating precipitation events (high totals being a 10-to-40 year event) and away from the extreme droughts of 2006-2019. Only time will tell.
While we are on a roll here - just how extreme were those drought years that preceded the deluge of 2022-23?
A standard measure of drought intensity is the Palmer Drought Index. Here is a graph of one version of that index for California from 1895 to the present.

The intensity-frequency relationship shows the usual pattern (up and to the right). 2004 was the worst ever, and the only year beyond -5, yielding a return time of 124 years! But the bigger story was that 2015 was the second worst year, and 2013 the sixth - the worst three year sequence in history. Similar extreme drought periods happened from 2006-2009 and 2017-2019. You can see how the idea of a permanent shift in the climate in the state had taken hold. It was up to the winter of 2022/23 to bring good news in terms of water supply, to reverse that thinking about a permanent drought, and to refill the reservoirs and re-flood the dry lakebeds!

Rainfall in the Hudson River Valley
Since I set up the 1,000-year designation as media hype, you may be surprised by this story!
The downpour that struck the mid-Hudson River area on July 9 caused widespread flooding, especially in small and steep valleys where streams respond quickly to high rainfall rates. It also led to severe property damage and at least 1 death.
Just how intense was this storm?
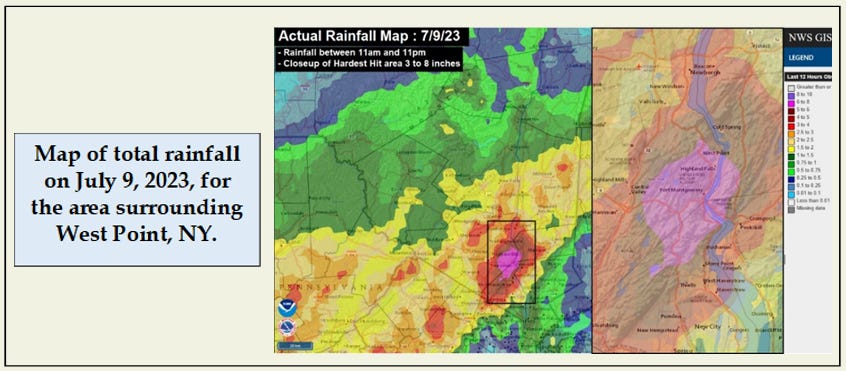
One thing about extreme precipitation events is that they can be very local. A map of cumulative rainfall for this storm shows a bullseye centered just south of West Point, NY, home of the U.S. Military Academy. Weather Service numbers for the county in which West Point sits showed a range in total rainfall amount for July 9 from a maximum of 7.71 inches at West Point to a minimum of 2.02 inches elsewhere in the same county.
Another site that reports cumulative rainfall totals showed 2.06 inches for West Point before the storm, and 11.56 inches after, so perhaps as much as 9.5 inches fell that day and the next. One source reported a total of 3.5 inches in one hour and 8 inches over "a couple" of hours.
How rare is such an extreme event?
In this case, the U.S. Weather service has done the work for us, producing this figure that charts the return time as a function of time frame (note that this is different from the other figures presented here). You can see that the shorter the time frame (Duration), the lower the amount of precipitation needed to reach a given return time.

How was this graph produced? How do you predict the chance of an event that has not happened yet? This NOAA site gives an excellent explanation. Using a different statistical summary that never goes to zero probability (shown below), the distribution of previous rainfall intensities can be used to predict out to any length of time. A 1,000-year event would have a probability of 0.1%. While mathematically sound, that far right "tail" of this distribution is still very dependent on major, rare events that actually have occurred!

The top line in that Depth-Duration-Frequency figure above is the 1,000-year return time predicted for West Point, NY. Rainfall reaching 3.5 inches in one hour is indeed near this line. If 8 inches fell in less than 6 hours, that, too, would be near the 1,000-year line. It is probably safe to say that a 1,000-year event has never happened before! This chart may have to be redrawn!
A 24-hour total of 9.5 inches would "only" rank as a 100-200-year storm, but the damage would have already been done. Those "flashy" streams in the small and steep valleys would flood in a matter of minutes to hours. The mighty Hudson, into which those streams drain, probably didn't even notice.
Summing Up
Some simple arithmetic lets us calculate a predicted return time for major weather events and seasons, but those estimates are very sensitive to the rarest and most extreme occurrences. Still, we can gain some perspective, and maybe fact-check some of the more extreme uses of the terms "500-year" and "1,000-year" event. Some might be accurate, some might not. The difference might be important for disaster preparedness planning.
Sources
An accessible list of Florida hurricanes is here:
https://en.wikipedia.org/wiki/List_of_Florida_hurricanes
Long-term monthly rainfall data for Los Angeles and San Francisco can be accessed here:
http://climod2.nrcc.cornell.edu/
Snow data for California can be found at this excellent site:
https://cdec.water.ca.gov/
Data for Rock Creek are here:
and for Parks Creek here:
Palmer Drought Index data are from:
The map of rainfall in the Hudson River Valley on July 9 was produced by NOAA and can be accessed here:
https://hudsonvalleyweather.com/1130pm-radar-discussion-7-9-23/
County-level rainfall amounts for July 9 are from the U.S. Weather Service
Daily and cumulative rainfall amounts are from:
http://climod2.nrcc.cornell.edu/
Reports of 3.5 inches per hour and as much as 8 inches over several hours are from:
https://www.army.mil/article/268366/west_point_community_responds_to_historic_flash_flood
The intensity-frequency diagram for the West Point station can be retrieved from:
https://hdsc.nws.noaa.gov/pfds/pfds_map_cont.html?bkmrk=ny
This is a good explanation of how to estimate extreme events that have never happened: