California has always been a place defined by extremes. It hosts the highest elevation in the contiguous 48 states (Mt. Whitney or Tumanguya at 14,505 feet) and, only 85 miles to the southeast, the lowest (Death Valley at 282 feet below sea level). Geological extremes are punctuated by one of the more active fault lines on the continent, the San Andreas fault, site of one of the most tragic earthquakes, the San Francisco quake of 1906.
The state also hosts both the tallest and most massive trees (the coastal redwoods and the giant sequoias) and perhaps the oldest trees on Earth (one dwarfed, spindly bristlecone pine is reported to be 4,800 years old).
Weather extremes are also part and parcel of the California environment. High peaks in the Sierra Nevada Mountains can accumulate more than 30 feet of snow in a year, while Death Valley, in the rain shadow of the Sierras, and one of the hottest places on Earth, receives almost no rain at all.
Total precipitation across the state is wildly variable from year to year. Extreme, multi-year droughts occurred from 2013 to 2015 and 2020 to 2022, resulting in major economic impacts on food production, and intense political conflicts over the allocation of what water was available. Dramatic images, like this one, capture the impacts of the 2013-2015 drought period on water levels in the extensive system of reservoirs statewide.
The most recent period of exceptionally dry weather also triggered record-breaking acreages burned by wildfires, especially in 2020.
So where is the good news? 2022/23 is shaping up as a totally different water year.
News sources are beginning to present the change as a disaster in the making. Reports tend to focus on the damage done by high winds and waves - especially on the most vulnerable or least prepared communities. The recently recognized phenomenon of Atmospheric Rivers tends to play a major role in these stories.
Reading deeper behind the headlines, many of the reported interviews with water managers slip in the idea that there is some good news in these storms for many in a state that has been wracked by record droughts for most of the last decade.
Also beyond the headlines are the data-rich sources that fail to excite, perhaps, but present a more accurate picture of the recent and, yes, dramatic shift in the water fortunes of the Golden State.
What are some of those sites and what can they tell us?
NOAA's National Weather Service tracks total rainfall for dozens of sites across the state and reports totals by month and for the current "water year" that begins October 1, at the end of the dry summer season and the beginning of the winter rainy season. This morning's report shows that central and southern coastal California stations are averaging about 30% above normal totals for this time of year. The agriculturally rich San Joaquin Valley area is 47% above.
The Weather Service also maps predicted rainfall and snowfall for the next 3 days. This morning's maps say to expect more than 2.3 inches of additional rain in San Francisco over that period, and nearly 1.5 inches in Los Angeles. Snow is expected to fall almost continuously in the Sierras, with rates often more than an inch per hour.
Their Climate Prediction Center posts generalized forecasts for 6-10 and 8-14 days ahead. Today's maps suggest continued high rates of precipitation.
Storms arriving onshore are lifted over the Sierras, squeezing out much higher precipitation totals, mostly as snow this time of year. Winter snow accumulation and an extended spring snowmelt season are particularly crucial for refilling depleted reservoirs and meeting water demands across the state for both urban and agricultural uses for the coming summer. Southern California also relies heavily on water from the Colorado River, but that is a story for another time.
Given the importance of water to the Golden State, it is not surprising that a major state agency is charged with monitoring this resource. In yet another example of good information made publicly available (many of which have been described in these essays), there is a state-supported website that presents very current data on snow accumulation, river flow, and the amount of water stored in those reservoirs.
The California Department of Water Resources (CDWR) operates the California Data Exchange Center which posts numbers on wells, rivers, snow, water quality and other topics, all with an eye toward ongoing changes in climate.
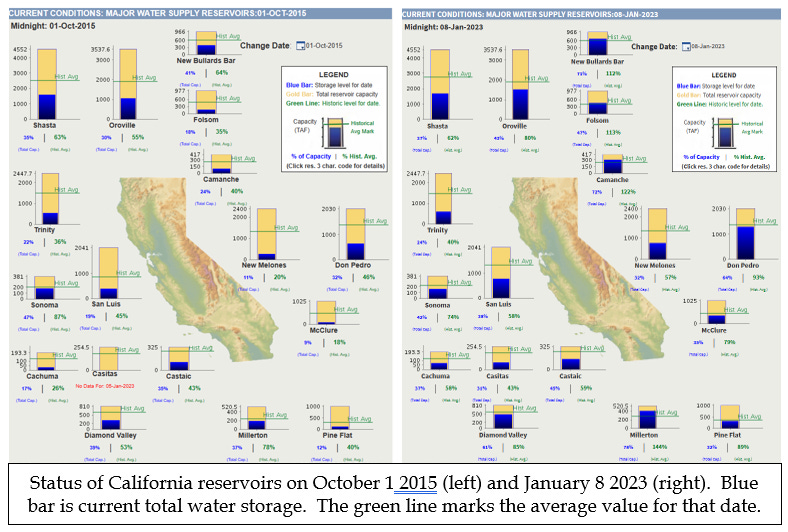
On their site, you can find data on the status of major reservoirs for any day and year.
For example, at the end of the severe drought through 2015, all major reservoirs were below the historical average for October 1 (green line). While significantly improved by January 8 of this year due to early, heavy rainfall, most are still below the historical average, and limitations on water allocations remain in place.
One longer-term solution to this limitation resides in the accumulating snows in the Sierras.
So here is a how-do-we-know question. Precipitation is routinely measured at many weather stations with a simple gauge, and water depth and content in reservoirs can be monitored remotely and precisely, but how do we know how much snow has accumulated across the remote and varied topography of the Sierras?
Here are three methods of varying technological complexity!
The most direct, perhaps, is having field crews make repeated visits to a selected set of sites, take core samples of the snow accumulated at each site, and weigh the core to determine total water content. As anyone who has shoveled both powder and slush knows, volume alone is not a good indicator of weight or total water content! While very direct and precise, logistics and expense limit the number of sites and frequency of sampling.
The data reported in the next figure are not from field surveys, but are collected automatically by electronic scales similar to the "snow pillows" shown here that continuously weigh the amount of snow load they carry. Each remote station is powered by a solar panel and includes an antenna for transmitting measurements.
A total of 117 automated snow-weighing stations throughout the Sierras are monitored by the CDWR. Results are reported as current totals and compared with average values for that date and for April 1, roughly the end of the snow-accumulation season. On April 1 2015, snow accumulations were about 5% of the historical average for that date. So far this year, average accumulations statewide are 92% above normal for this date, and already at 80% of the average value for April 1.
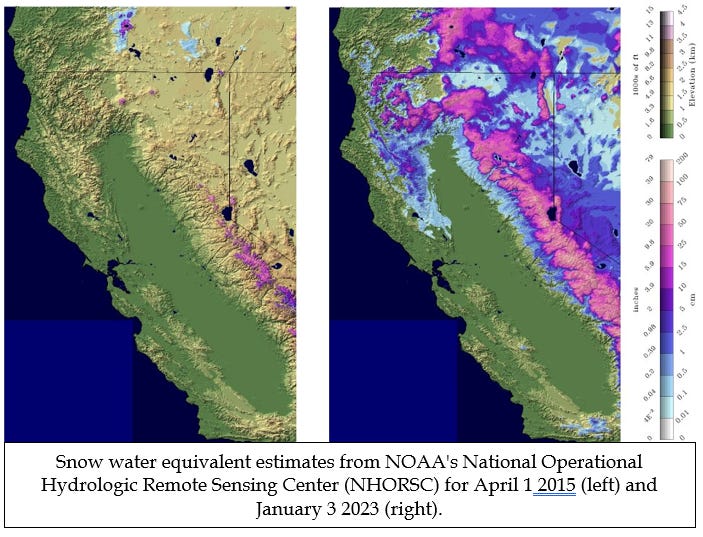
There is an additional, nationwide source for estimating snow water content. According to its website, NOAA's National Operational Hydrologic Remote Sensing Center (NHORSC)
ingests daily ground-based, airborne, and satellite snow observations from all available electronic sources for the coterminous U.S. These data are used…to generate the…daily NOAA National Snow Analyses (NSA)…at a 1-km² spatial resolution and hourly temporal resolution for the nation.
Given the number of data sources, and their frequency and volume, "ingests" seems a very appropriate term! The system is truly a data monster, rivaling the complexity of the models used to predict the weather.
Again, the precision and frequency of available images is astounding, and the comparison between April 1 2015 and near-current conditions captures the differences between these two water years. Estimates of snow water equivalent from the NOAA site and California agency site appear to be in close agreement.
It has been said many times in essays on this Substack site that we have amazing capabilities to acquire accurate, real-time data on the state of a huge variety of environmental variables and conditions. We can generally explain why a certain pattern is unfolding - what are the immediate causes. We are less able to predict the kind of longer-term change in pattern described here.
I know of no site or agency that predicted the dramatic shift in the water status of California that has unfolded so far this year, although recent stories about Atmospheric Rivers and a devastating flood in 1862 have established precedence for this kind of seismic reversal.
One of the strongest long-term (at the scale of several months) connections between an observable index of the state of the global climate system and predicted weather patterns at a distant location (called teleconnections) has been between El Niño and rainfall in California.
The state of the El Niño or ENSO system is captured as the change in sea surface temperature in the Central Pacific Ocean. Excessively warm surface waters there (which define an El Niño event) had been strongly connected to major storms and high total rainfall in California. The three strong El Niños recorded in 1972/73, 1982/83 and 1997/98 led to major storm damage along the California coast. The die seemed cast - warm temperatures in the Pacific means major rains and storms in California.
And then there was the strongest El Niño signal ever recorded which occurred from late 2014 through early 2016 and peaked in the winter of 2015/16 at the height of the 2013-2015 drought in California. This led many (including myself) to predict an end to the drought that winter. Didn't happen. Rainfall was lower than average in Los Angeles that year, and only recovered the following year when Pacific Ocean temperatures were below average (a La Niña condition). A new phenomenon, "the Blob" or a large area of super-warm water in the far Northern Pacific, was cited as the cause, and a new area of research, marine heat waves, was firmly established.
This year's increases in storms and precipitation in California are happening during another La Niña period, one that has lasted since the summer of 2020.
All of this is just to say that while long-term increases in global average temperature, and accelerating polar ice melt and sea level rise are clear and inevitable, prediction of variation at the scale of several years across major regions continues to elude us. Driven by what are called "oscillations" (and there are several described for basically every part of the climate system, El Niño being just the most famous), these oscillations will continue to provide surprises on our path to a warmer world.
How oscillations will interact with a generally warmer and wetter atmosphere is perhaps the biggest unknown in our short-term climate future, and California may well continue to be ground zero for the impacts of those unpredictable weather excursions.


