

Two Hopeful Trends for Our Climate Future
Declining birth rates and increasing carbon efficiency could lead to net zero


College students and popular audiences can be overwhelmed by the “bad news” that is the focus of most presentations on climate change, including my own. This essay resulted from the search for a way to present some trends that might offer more hope for the future. It also sets the stage for a later essay on an intuitive approach to the climate system, and a reflection on how we view “The Population Bomb.”

Short-Term News and Long-Term Trends
The 24-hour news cycle focuses our attention on the immediate tragedies and crises caused by a warming climate system. Floods, storms, fires, heat waves and all the rest are vital news stories, but divert communal attention from a longer-term view focused on what we should do to slow global warming and reduce the frequency of climate tragedies.
Curbing the increase in greenhouse gases in the atmosphere is central to slowing the global increase in temperature. Many strategies have been proposed, and some undertaken, in pursuit of net zero carbon, but it can be difficult to see any cumulative impact of all of these efforts when the Keeling curve of carbon dioxide in the atmosphere and the GISS data on global average temperature continue to climb. Fewer initiatives are aimed at the next two primary greenhouse gases, methane (CH4) and nitrous oxide (N2O).

But here are two signals that may offer some hope. Both are controversial and both reflect complex social, economic, and political interactions that are far beyond the scope of these science essays, but if these two long-term trends continue as they have for the last five decades, we could see a slowing of the rate of increase in both carbon dioxide and temperature.
Those two trends are the declining rate of population increase and the increasing carbon efficiency of the global economy.
The first of these two has become controversial of late, so let’s start with the second.
Increasing Efficiency
Publicly available data sets (listed under Sources below) present numbers for population, total annual global gross domestic product (GDP), and total carbon dioxide emissions. An index of carbon efficiency is carbon dioxide emitted per unit economic output (expressed in inflation-corrected U.S. Dollars). In these units, the carbon efficiency of the global economy appears to have doubled from 1970 to 2020 (emissions per unit GDP has dropped by ~50%).

The increase in efficiency has not led to a decrease in emissions as the global economy has grown more than four-fold (inflation-corrected). Even though the number of people in the world has more than doubled, per capita income has also doubled. In simplest terms and in round numbers, carbon dioxide emissions have increased even while carbon efficiency has doubled because both economic activity per person and total population have doubled as well.
Decreasing Fertility
While total human numbers have doubled from 1970-2020, the rate of increase (percent increase per year) has dropped steadily, driven by ever-falling fertility rates (total number of children born per woman). Declining percentage rates of increase multiplied by a growing number of people has led to a roughly constant increase in population since 1970, but if fertility rates continue to drop as they have been, human numbers could peak and then begin to decline before the end of the century.

Declining fertility rates are a nearly universal characteristic of what is called the demographic transition. This theory of population dynamics holds that as a nation’s economic well-being increases, an initial phase of high fertility and falling mortality leads to an increase in population until fertility also falls to match or drop below mortality. Science may have little to say about the complex social, economic, and political forces driving this amazingly consistent trend, but as an observation, countries that have completed this transition have only rarely reverted to higher rates of population growth.

The declining birth rate in developed countries has become something of a hot topic. Some, ranging from pundits to national leaders (in some countries), seem bent on bringing social pressure to bear on a very personal decision – whether or not to have children, or how many - in order to reverse population declines.
What If These Trends Continue?
It is an interesting exercise to project these very strong linear trends in efficiency and rate of population increase into the future. Interesting but also fraught.
Much of the world appears to be committed to increasing the carbon efficiency of the global economy without sacrificing economic growth, but perhaps the low hanging fruit have been picked. Increasing fuel efficiency in vehicles, insulating buildings, replacing coal with natural gas to generate electricity, and many other strategies have been employed with much apparent success. The next phase could revolve around increasing the pace of the conversion to low-carbon energy sources like solar and wind, and electrifying the economy, and that will be a larger and more difficult transition.
Whether the demographic transition continues to proceed or is reversed by social or political pressure is also not a scientific question, but the evidence argues against reversals away from both low mortality and low fertility that define the end stage of that transition.
Keeping these caveats in mind, what happens if efficiency and the rate of population increase continue to increase and drop (respectively) at the same rates as they have over the past 50 years? Remember that these are not predictions from detailed models, just extensions of measured statistical trends.

Even if the measured long-term decline in the rate of global population increase continues, human numbers will still approach 10 billion by 2060. More complex analyses tend to converge on the same maximum number and timing as well (for example, see the link to U.N. projections under Sources below).
While the demographic transition appears to have considerable momentum and is predicted to continue to move more countries into the end-stage of stable to perhaps falling numbers, the future carbon efficiency of the global economy is less certain.
The simple arithmetic effect of a continuing linear decline in carbon emissions per unit economic output is that this value eventually (about 2075) reaches zero – a carbon neutral global economy! At that point, the size of the human population and the size of the global economy no longer affect carbon dioxide emissions.

A more complete statistical model presented in an earlier essay suggests that carbon dioxide concentrations in the atmosphere in 2075 would have stabilized at just over 500 parts per million and global temperature increase would also plateau at about 1.8 degrees Celsius above the 1970 value. Those essays also present the impacts of NOT maintaining these two rates of change.
Intriguingly, these projections are nearly identical to predictions made by the complex models employed by the IPCC (Intergovernmental Panel on Climate Change) using their reduced carbon emissions scenario labeled SSP1-2.6.
When Do Other Greenhouse Gases (and Population) Become the Dominant Drivers of Climate Change?
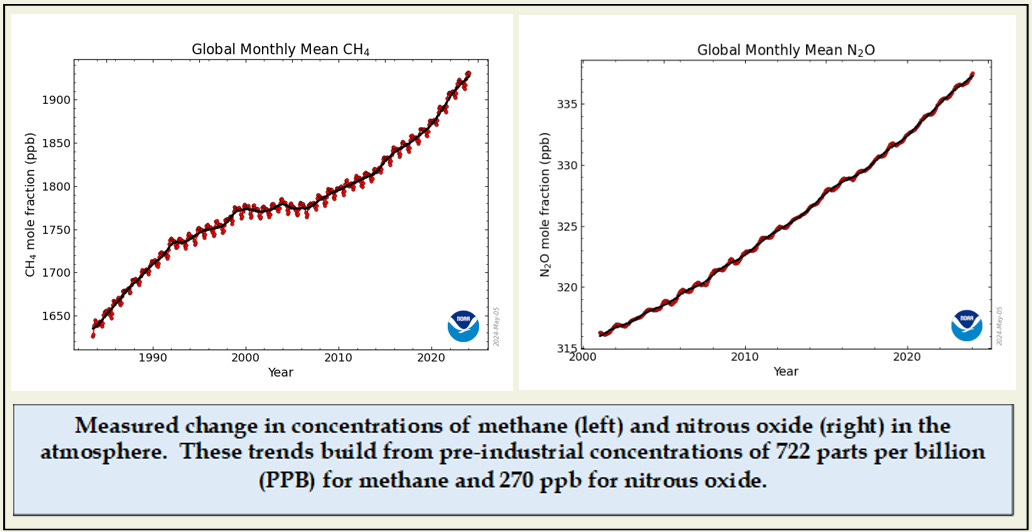
Stabilizing carbon dioxide in the atmosphere is the primary goal of many proposals to limit climate change, and a noble one. But carbon dioxide is not the only greenhouse gas, and if we are successful in limiting emissions of this greenhouse gas, others, notably methane and nitrous oxide, could become more important.
And this is where population size becomes again a primary driver of climate change.
Carbon dioxide is produced primarily through the combustion of fossil fuels. Both methane and nitrous oxide emissions have energy components, but both are generated by agriculture and food system processes as well. Both have been increasing rapidly, and, as with carbon dioxide, both have changed in parallel with human numbers. An additional 25% increase in population (from 8 to 10 billion) would logically require an equal increase in food production.
Globally, agriculture is thought to contribute about 11% of the total greenhouse gas enhancement of heat retention and global warming. Moving economic production to a zero carbon balance would have little effect on the warming potential generated by agriculture. A 25% increase in population would, again, suggest a similar increase in greenhouse gas emissions through food production.
In the U.S., nitrous oxide and methane contribute 18% to total greenhouse gas loading, with about 80% of nitrous oxide and 35% of methane emissions coming from agriculture and wastewater treatment.
Some efforts have been made to change diets (less beef) and agricultural practices (more efficient use of nitrogen fertilizers) and other steps that might limit the emissions of these gases, but these have not received the level of attention that has been given to the energy system and carbon dioxide.
A More Hopeful Future?
Trends in human numbers and the carbon efficiency of the global economy over the last 50 years might offer some hope for curbing global warming, if those trends continue. Both technical limitations (carbon efficiency) and social pressures (population) could challenge those trends. Achieving a carbon neutral economy would be a major accomplishment. Addressing the continuing impacts of agriculture on the emissions of methane and nitrous oxide would be the next step, and would mean reshaping agriculture and the food system in addition to the energy system.
Sources
Data for the Keeling Curve are from:
https://scrippsco2.ucsd.edu/data/atmospheric_co2/primary_mlo_co2_record.html
The GISS temperature data are from:
https://data.giss.nasa.gov/gistemp/
Data on global GDP and Population are from:
https://data.worldbank.org/indicator/NY.GDP.MKTP.CD
Carbon dioxide emission data used here are from:
An introduction to the demographic transition can be found here:
https://en.wikipedia.org/wiki/Demographic_transition#
U.N. prediction of future population levels are here:
https://www.un.org/en/global-issues/population
A summary of the IPCC SSP climate scenarios can be found here:
https://en.wikipedia.org/wiki/Shared_Socioeconomic_Pathways
Trends in the concentration of methane and nitrous oxide are from:
https://gml.noaa.gov/ccgg/trends_n2o/
Pre-industrial methane and nitrous oxide concentrations are from:
https://en.wikipedia.org/wiki/Atmospheric_methane
https://en.wikipedia.org/wiki/Nitrous_oxide
Numbers for global production of greenhouse gases from agriculture are from:
https://www.c2es.org/content/international-emissions/
Data on nitrous oxide and methane emissions for the U.S. are from:
https://www.epa.gov/ghgemissions/overview-greenhouse-gases
The discussion of methane, nitrous oxide and agriculture is drawn in part from:
https://eos.org/features/simpler-presentations-of-climate-change
co-authored with Scott Ollinger